H12 / Angola An. coluzzii / Chromosome 2 / #1
This page describes a signal of selection found in the
Angola An. coluzzii population using the
H12 (Garud et al. 20XX) statistic.The focus of this signal is on chromosome arm
2R between positions 28,060,001 and
28,100,000.
The evidence supporting this signal is
strong ( >= 100 on both flanks).
Signal location. Blue markers show the values of the selection statistic. The dashed black line shows the fitted peak model. The shaded red area shows the focus of the selection signal. The shaded blue area shows the genomic region in linkage with the selection event. Use the mouse wheel or the controls at the top right of the plot to zoom in, and hover over genes to see gene names and descriptions.
Genes
The following 6 genes overlap the focal region: AGAP002828, AGAP002829 (SPN-E - ATP-dependent RNA helicase spindle-E), AGAP0028301 (C-1-tetrahydrofolate synthase, mitochondrial precursor), AGAP002831 (ribosomal RNA small subunit methyltransferase H), AGAP013130, AGAP002832 (protein-tyrosine phosphatase).
The following 3 genes are within 50 kbp of the focal region: AGAP002824 (GPRTAK1 - putative tachykinin receptor 1), AGAP0028251 (PPO1 - prophenoloxidase 1), AGAP002826.
Key to insecticide resistance candidate gene types: 1 metabolic; 2 target-site; 3 behavioural; 4 cuticular.
Diagnostics
The information below provides some diagnostics from the Peak modelling algorithm.
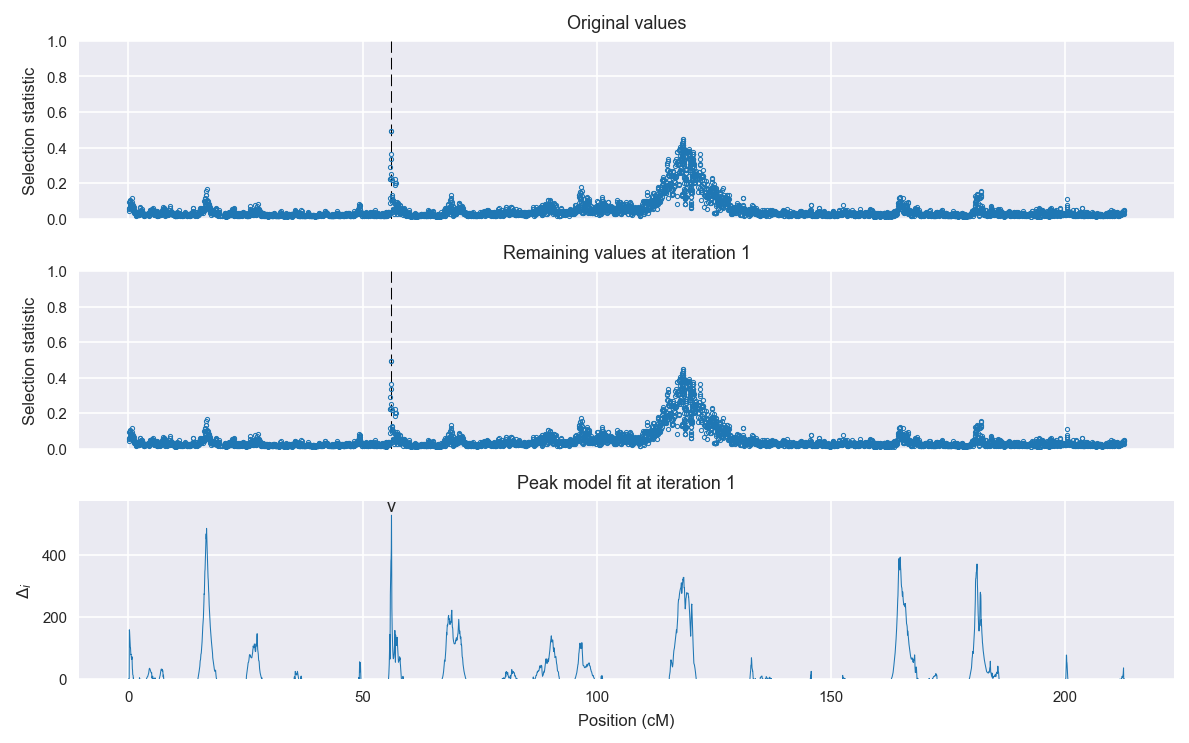
Selection signal in context. @@TODO
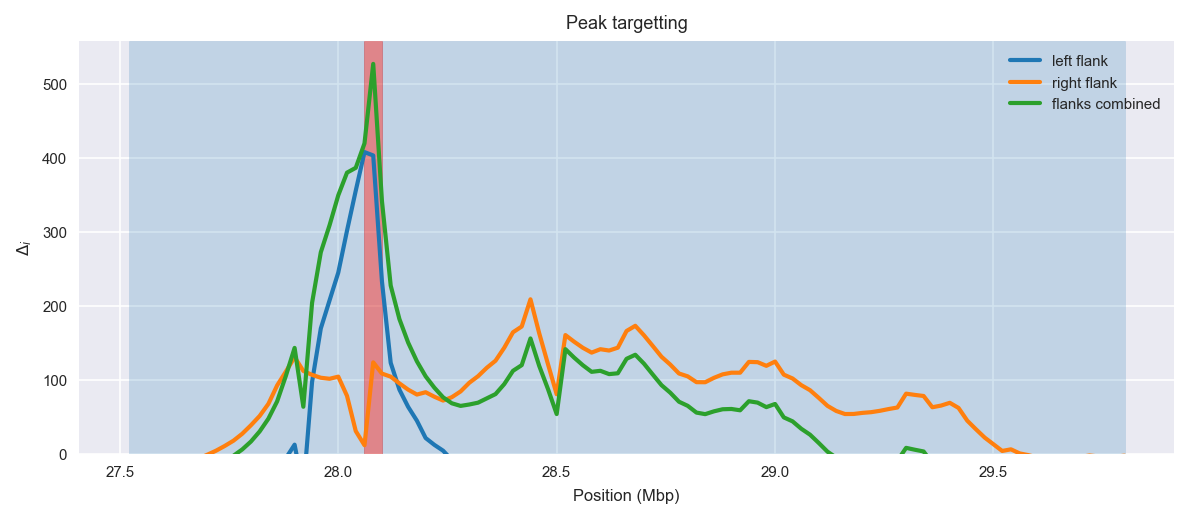
Peak targetting. @@TODO
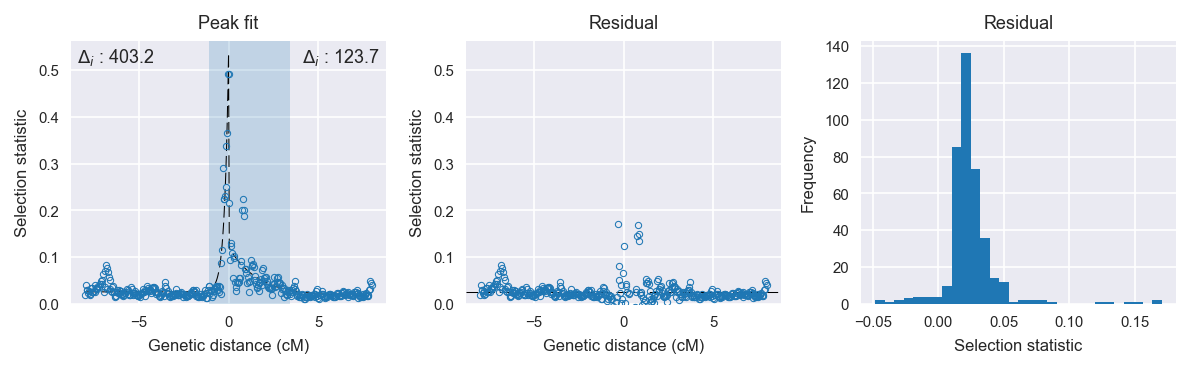
Peak fitting diagnostics. @@TODO
Model fit reports
Left flank, peak model:
[[Model]]
    Model(exponential)
[[Fit Statistics]]
    # function evals   = 31
    # data points      = 201
    # variables        = 3
    chi-square         = 0.066
    reduced chi-square = 0.000
    Akaike info crit   = -1605.461
    Bayesian info crit = -1595.551
[[Variables]]
    amplitude:   0.51064878 +/- 0.013118 (2.57%) (init= 0.5)
    decay:       0.22201650 +/- 0.009068 (4.08%) (init= 0.5)
    c:           0.02578251 +/- 0.001368 (5.31%) (init= 0.03)
    cap:         1 (fixed)
[[Correlations]] (unreported correlations are <  0.100)
    C(amplitude, decay)          = -0.614
    C(decay, c)                  = -0.242
Right flank, peak model:
[[Model]]
    Model(exponential)
[[Fit Statistics]]
    # function evals   = 35
    # data points      = 199
    # variables        = 3
    chi-square         = 0.114
    reduced chi-square = 0.001
    Akaike info crit   = -1478.638
    Bayesian info crit = -1468.758
[[Variables]]
    amplitude:   0.10489720 +/- 0.007855 (7.49%) (init= 0.5)
    decay:       1.59869992 +/- 0.255201 (15.96%) (init= 0.5)
    c:           0.01716838 +/- 0.003360 (19.57%) (init= 0.03)
    cap:         1 (fixed)
[[Correlations]] (unreported correlations are <  0.100)
    C(decay, c)                  = -0.755
    C(amplitude, decay)          = -0.443
Left flank, null model:
[[Model]]
    Model(constant)
[[Fit Statistics]]
    # function evals   = 6
    # data points      = 199
    # variables        = 1
    chi-square         = 0.468
    reduced chi-square = 0.002
    Akaike info crit   = -1202.273
    Bayesian info crit = -1198.980
[[Variables]]
    c:   0.03665340 +/- 0.003448 (9.41%) (init= 0.03)
Right flank, null model:
[[Model]]
    Model(constant)
[[Fit Statistics]]
    # function evals   = 6
    # data points      = 198
    # variables        = 1
    chi-square         = 0.209
    reduced chi-square = 0.001
    Akaike info crit   = -1354.950
    Bayesian info crit = -1351.662
[[Variables]]
    c:   0.03687920 +/- 0.002315 (6.28%) (init= 0.03)