H12 / Angola An. coluzzii / Chromosome 3 / #4
This page describes a signal of selection found in the
Angola An. coluzzii population using the
H12 (Garud et al. 20XX) statistic.The focus of this signal is on chromosome arm
3L between positions 22,440,001 and
22,540,000.
The evidence supporting this signal is
moderate ( >= 50 on both flanks).
Signal location. Blue markers show the values of the selection statistic. The dashed black line shows the fitted peak model. The shaded red area shows the focus of the selection signal. The shaded blue area shows the genomic region in linkage with the selection event. Use the mouse wheel or the controls at the top right of the plot to zoom in, and hover over genes to see gene names and descriptions.
Genes
The following 2 genes overlap the focal region: AGAP011376, AGAP011377.
The following 2 genes are within 50 kbp of the focal region: AGAP011374 (AP-1 complex subunit mu), AGAP011375 (Selenophosphate synthetase 2).
Key to insecticide resistance candidate gene types: 1 metabolic; 2 target-site; 3 behavioural; 4 cuticular.
Diagnostics
The information below provides some diagnostics from the Peak modelling algorithm.
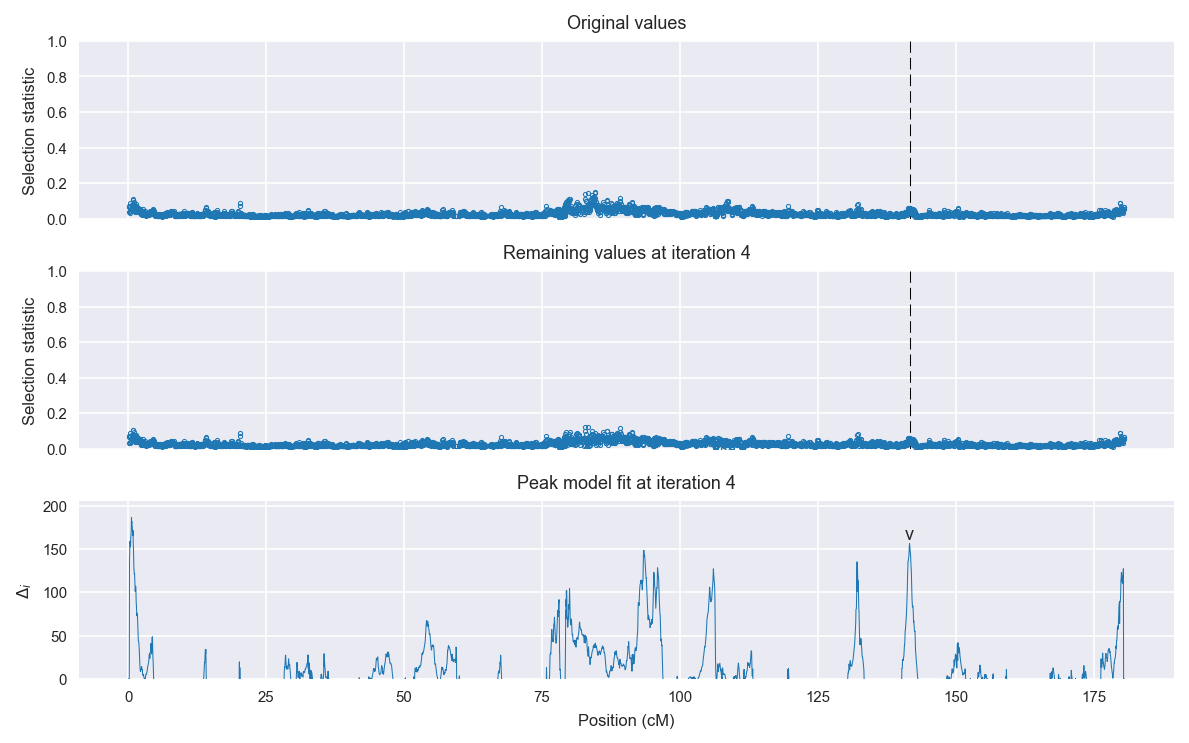
Selection signal in context. @@TODO
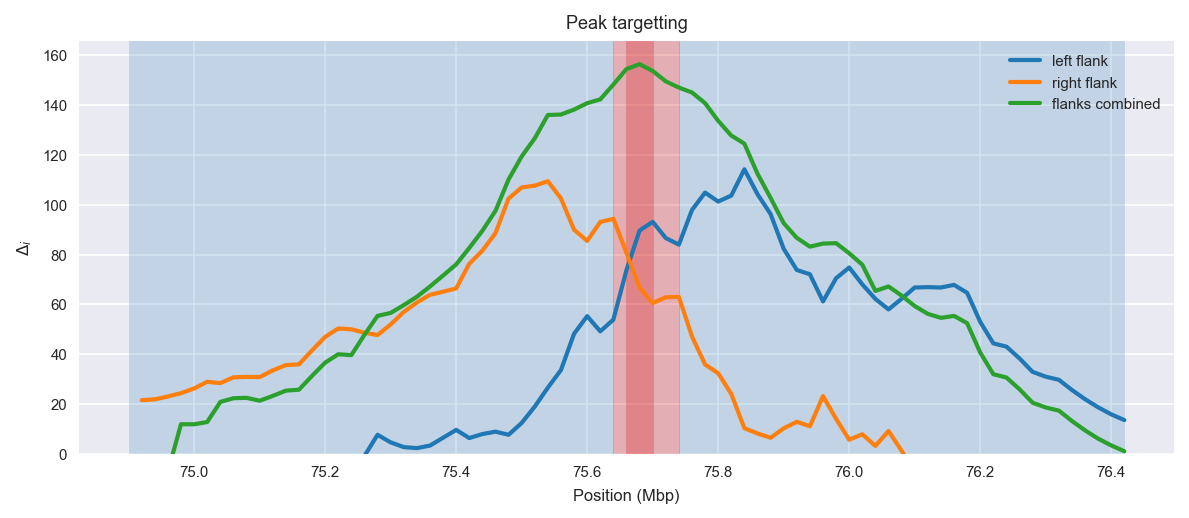
Peak targetting. @@TODO
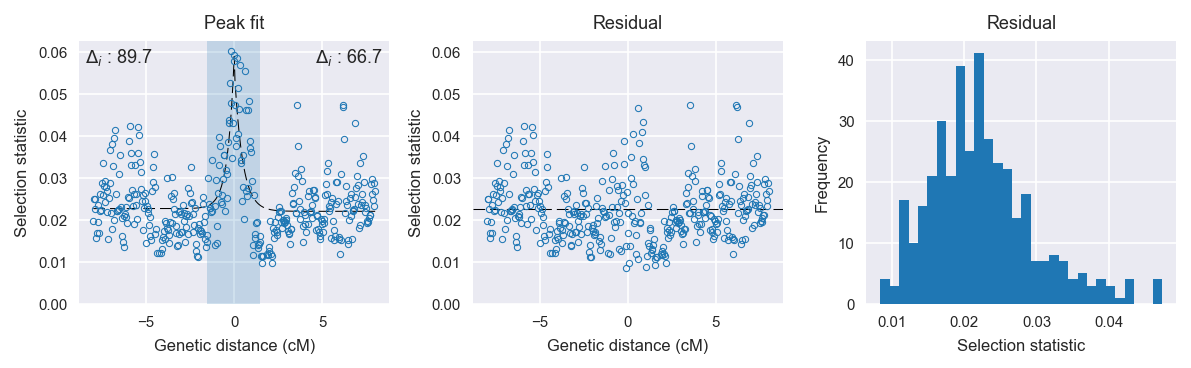
Peak fitting diagnostics. @@TODO
Model fit reports
Left flank, peak model:
[[Model]]
    Model(exponential)
[[Fit Statistics]]
    # function evals   = 27
    # data points      = 195
    # variables        = 3
    chi-square         = 0.009
    reduced chi-square = 0.000
    Akaike info crit   = -1933.545
    Bayesian info crit = -1923.726
[[Variables]]
    amplitude:   0.03627823 +/- 0.004111 (11.33%) (init= 0.5)
    decay:       0.37820572 +/- 0.067786 (17.92%) (init= 0.5)
    c:           0.02270548 +/- 0.000554 (2.44%) (init= 0.03)
    cap:         1 (fixed)
[[Correlations]] (unreported correlations are <  0.100)
    C(amplitude, decay)          = -0.627
    C(decay, c)                  = -0.317
Right flank, peak model:
[[Model]]
    Model(exponential)
[[Fit Statistics]]
    # function evals   = 41
    # data points      = 193
    # variables        = 3
    chi-square         = 0.011
    reduced chi-square = 0.000
    Akaike info crit   = -1872.374
    Bayesian info crit = -1862.585
[[Variables]]
    amplitude:   0.03395799 +/- 0.005005 (14.74%) (init= 0.5)
    decay:       0.46334983 +/- 0.099305 (21.43%) (init= 0.5)
    c:           0.02205737 +/- 0.000635 (2.88%) (init= 0.03)
    cap:         1 (fixed)
[[Correlations]] (unreported correlations are <  0.100)
    C(amplitude, decay)          = -0.697
    C(decay, c)                  = -0.349
Left flank, null model:
[[Model]]
    Model(constant)
[[Fit Statistics]]
    # function evals   = 6
    # data points      = 194
    # variables        = 1
    chi-square         = 0.014
    reduced chi-square = 0.000
    Akaike info crit   = -1843.886
    Bayesian info crit = -1840.618
[[Variables]]
    c:   0.02435925 +/- 0.000618 (2.54%) (init= 0.03)
Right flank, null model:
[[Model]]
    Model(constant)
[[Fit Statistics]]
    # function evals   = 6
    # data points      = 192
    # variables        = 1
    chi-square         = 0.016
    reduced chi-square = 0.000
    Akaike info crit   = -1805.638
    Bayesian info crit = -1802.380
[[Variables]]
    c:   0.02380931 +/- 0.000653 (2.74%) (init= 0.03)