H12 / Angola An. coluzzii / Chromosome 3 / #5
This page describes a signal of selection found in the
Angola An. coluzzii population using the
H12 (Garud et al. 20XX) statistic.The focus of this signal is on chromosome arm
3L between positions 17,740,001 and
17,780,000.
The evidence supporting this signal is
moderate ( >= 50 on both flanks).
Signal location. Blue markers show the values of the selection statistic. The dashed black line shows the fitted peak model. The shaded red area shows the focus of the selection signal. The shaded blue area shows the genomic region in linkage with the selection event. Use the mouse wheel or the controls at the top right of the plot to zoom in, and hover over genes to see gene names and descriptions.
Genes
Gene AGAP011134 (LIM homeobox protein 5) overlaps the focal region.
The following 8 genes are within 50 kbp of the focal region: AGAP011131 (F-type H -transporting ATPase subunit d), AGAP011132 (GINS complex subunit 3), AGAP0111331 (Inosine-5’-monophosphate dehydrogenase), AGAP011135 (synaptosomal-associated protein, 29kDa), AGAP011136, AGAP011137 (Thiomorpholine-carboxylate dehydrogenase), AGAP011138 (myosin XVIII), AGAP011139.
Key to insecticide resistance candidate gene types: 1 metabolic; 2 target-site; 3 behavioural; 4 cuticular.
Diagnostics
The information below provides some diagnostics from the Peak modelling algorithm.
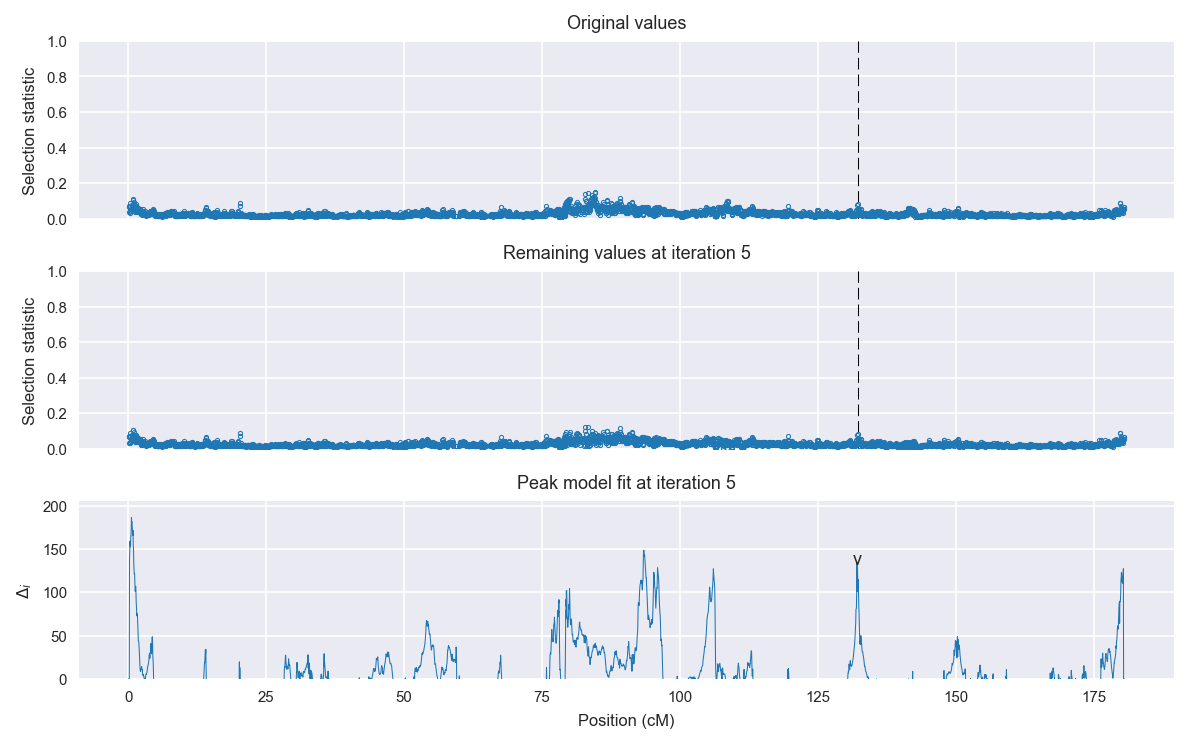
Selection signal in context. @@TODO
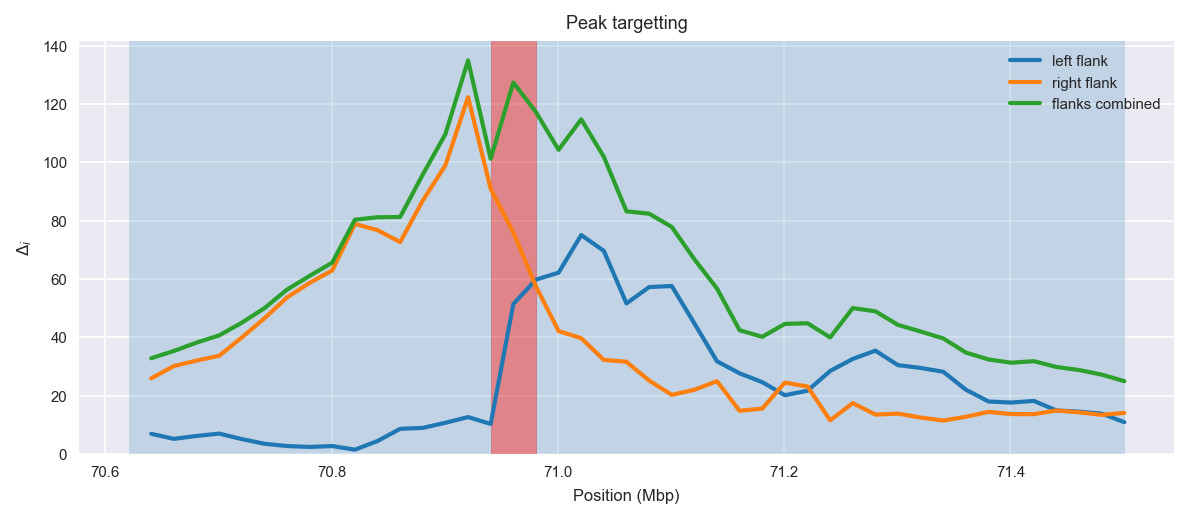
Peak targetting. @@TODO
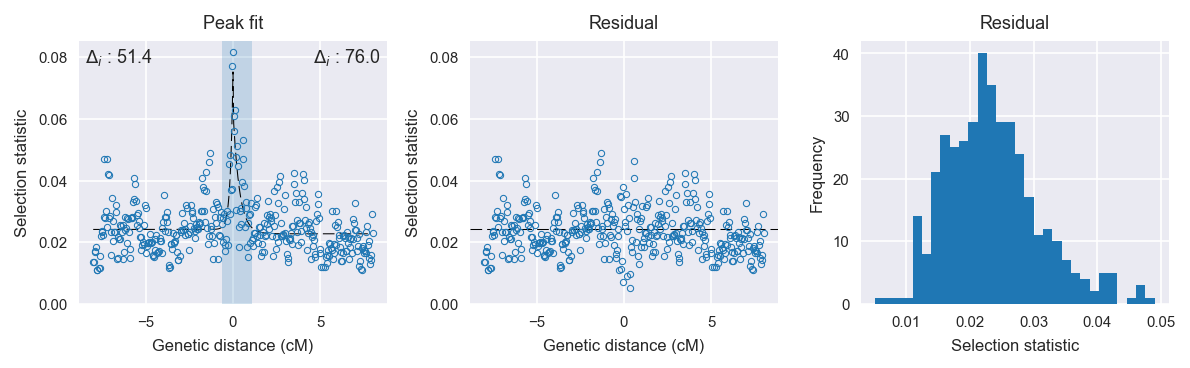
Peak fitting diagnostics. @@TODO
Model fit reports
Left flank, peak model:
[[Model]]
    Model(exponential)
[[Fit Statistics]]
    # function evals   = 43
    # data points      = 198
    # variables        = 3
    chi-square         = 0.011
    reduced chi-square = 0.000
    Akaike info crit   = -1929.057
    Bayesian info crit = -1919.192
[[Variables]]
    amplitude:   0.05111713 +/- 0.006163 (12.06%) (init= 0.5)
    decay:       0.15000000 +/- 0.023769 (15.85%) (init= 0.5)
    c:           0.02416080 +/- 0.000562 (2.33%) (init= 0.03)
    cap:         1 (fixed)
[[Correlations]] (unreported correlations are <  0.100)
    C(amplitude, decay)          =  0.588
    C(decay, c)                  =  0.199
Right flank, peak model:
[[Model]]
    Model(exponential)
[[Fit Statistics]]
    # function evals   = 39
    # data points      = 196
    # variables        = 3
    chi-square         = 0.010
    reduced chi-square = 0.000
    Akaike info crit   = -1925.975
    Bayesian info crit = -1916.140
[[Variables]]
    amplitude:   0.03998297 +/- 0.005452 (13.64%) (init= 0.5)
    decay:       0.36047902 +/- 0.069301 (19.22%) (init= 0.5)
    c:           0.02275166 +/- 0.000577 (2.54%) (init= 0.03)
    cap:         1 (fixed)
[[Correlations]] (unreported correlations are <  0.100)
    C(amplitude, decay)          = -0.714
    C(decay, c)                  = -0.318
Left flank, null model:
[[Model]]
    Model(constant)
[[Fit Statistics]]
    # function evals   = 6
    # data points      = 197
    # variables        = 1
    chi-square         = 0.014
    reduced chi-square = 0.000
    Akaike info crit   = -1877.667
    Bayesian info crit = -1874.384
[[Variables]]
    c:   0.02497673 +/- 0.000605 (2.42%) (init= 0.03)
Right flank, null model:
[[Model]]
    Model(constant)
[[Fit Statistics]]
    # function evals   = 6
    # data points      = 195
    # variables        = 1
    chi-square         = 0.015
    reduced chi-square = 0.000
    Akaike info crit   = -1849.993
    Bayesian info crit = -1846.720
[[Variables]]
    c:   0.02429360 +/- 0.000622 (2.56%) (init= 0.03)