H12 / Burkina Faso An. coluzzii / Chromosome 2 / #5
This page describes a signal of selection found in the
Burkina Faso An. coluzzii population using the
H12 (Garud et al. 20XX) statistic.The focus of this signal is on chromosome arm
2R between positions 24,820,001 and
24,860,000.
The evidence supporting this signal is
strong ( >= 100 on both flanks).
Signal location. Blue markers show the values of the selection statistic. The dashed black line shows the fitted peak model. The shaded red area shows the focus of the selection signal. The shaded blue area shows the genomic region in linkage with the selection event. Use the mouse wheel or the controls at the top right of the plot to zoom in, and hover over genes to see gene names and descriptions.
Genes
The following 6 genes overlap the focal region: AGAP002636, AGAP002637, AGAP013045, AGAP002638 (ABCH1 - ATP-binding cassette transporter (ABC transporter) family H member 1), AGAP0026393 (Or39 - odorant receptor 39), AGAP0026403 (Or38 - odorant receptor 38).
The following 15 genes are within 50 kbp of the focal region: AGAP002634 (membrane dipeptidase), AGAP0026353 (Gr13 - gustatory receptor 13), AGAP013517, AGAP013086, AGAP013456, AGAP013225, AGAP013322, AGAP013353, AGAP013110, AGAP013484, AGAP013247, AGAP013316, AGAP002641, AGAP002642 (DNA mismatch repair protein MSH5), AGAP002643.
Key to insecticide resistance candidate gene types: 1 metabolic; 2 target-site; 3 behavioural; 4 cuticular.
Diagnostics
The information below provides some diagnostics from the Peak modelling algorithm.
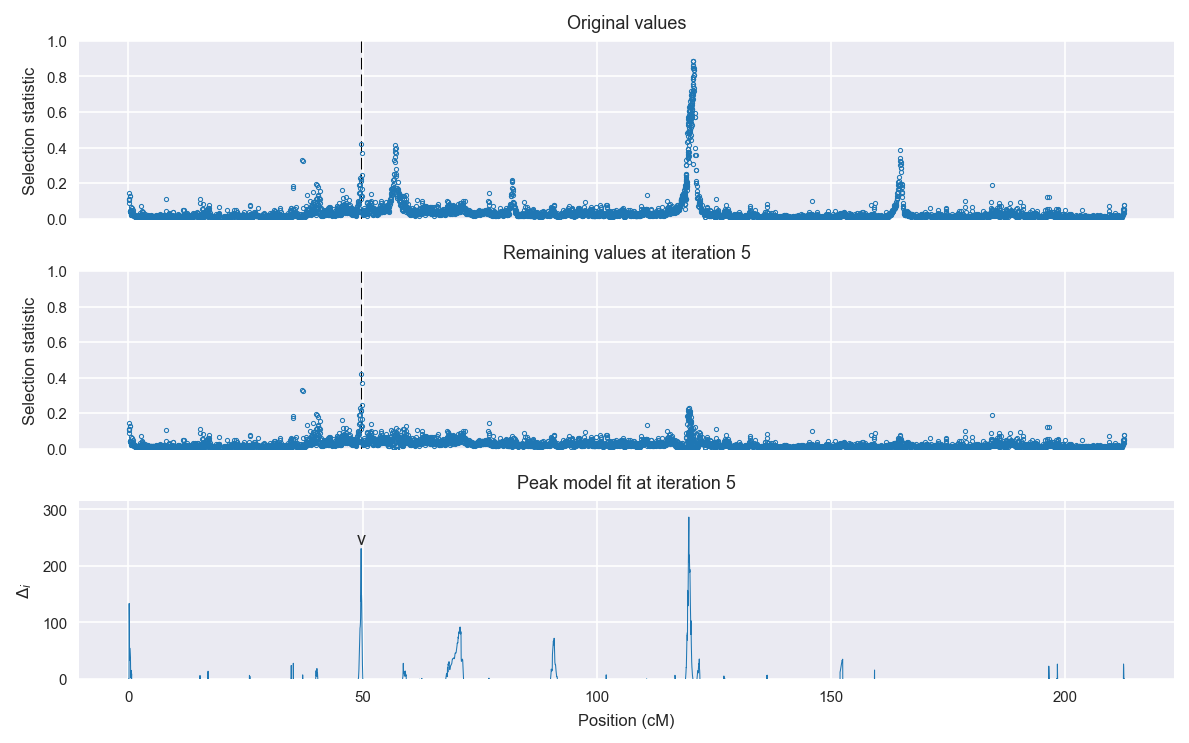
Selection signal in context. @@TODO
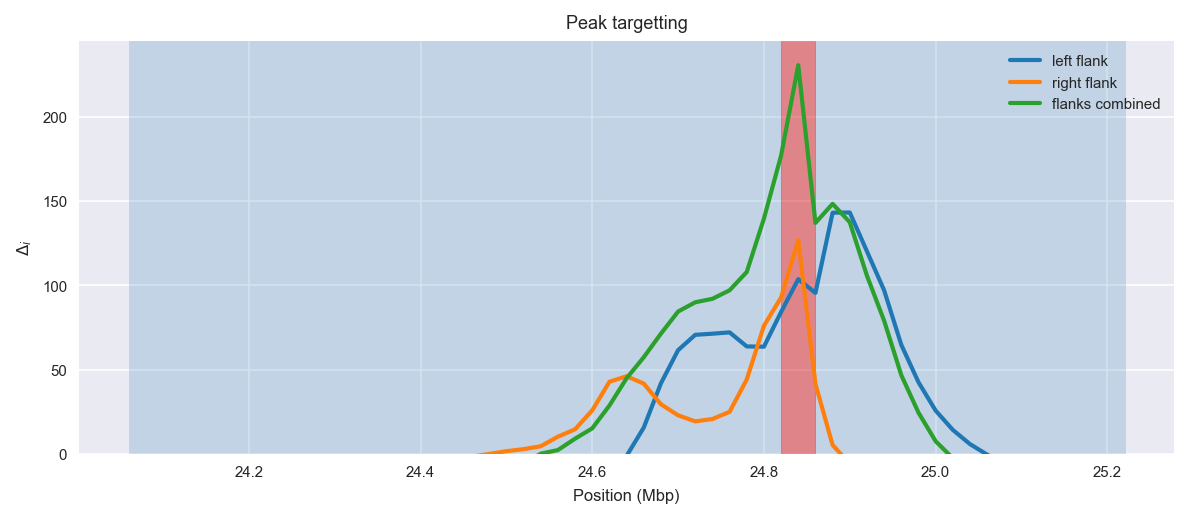
Peak targetting. @@TODO
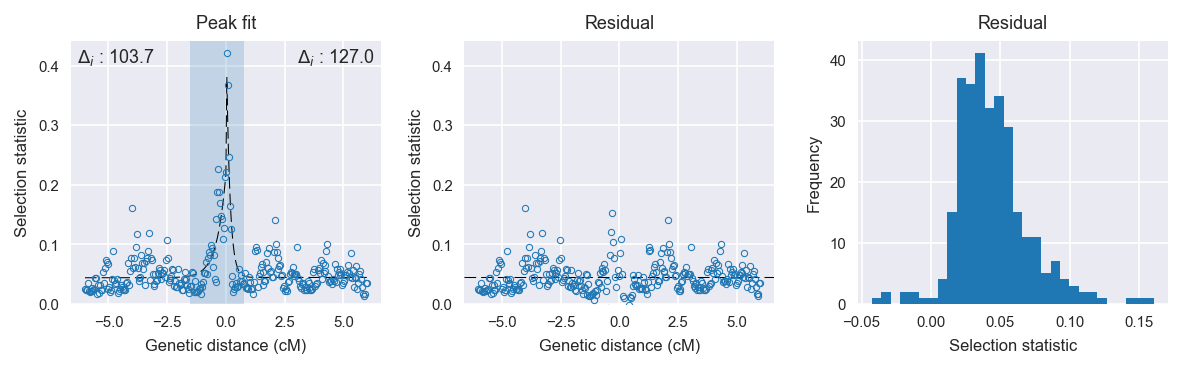
Peak fitting diagnostics. @@TODO
Model fit reports
Left flank, peak model:
[[Model]]
    Model(exponential)
[[Fit Statistics]]
    # function evals   = 47
    # data points      = 151
    # variables        = 3
    chi-square         = 0.117
    reduced chi-square = 0.001
    Akaike info crit   = -1075.643
    Bayesian info crit = -1066.591
[[Variables]]
    amplitude:   0.17417552 +/- 0.016473 (9.46%) (init= 0.5)
    decay:       0.38088942 +/- 0.057956 (15.22%) (init= 0.5)
    c:           0.04395788 +/- 0.002645 (6.02%) (init= 0.03)
    cap:         1 (fixed)
[[Correlations]] (unreported correlations are <  0.100)
    C(amplitude, decay)          = -0.607
    C(decay, c)                  = -0.380
Right flank, peak model:
[[Model]]
    Model(exponential)
[[Fit Statistics]]
    # function evals   = 55
    # data points      = 150
    # variables        = 3
    chi-square         = 0.098
    reduced chi-square = 0.001
    Akaike info crit   = -1094.746
    Bayesian info crit = -1085.714
[[Variables]]
    amplitude:   0.43961172 +/- 0.035590 (8.10%) (init= 0.5)
    decay:       0.15000000 +/- 0.002698 (1.80%) (init= 0.5)
    c:           0.04447701 +/- 0.002217 (4.99%) (init= 0.03)
    cap:         1 (fixed)
[[Correlations]] (unreported correlations are <  0.100)
    C(amplitude, decay)          = -0.782
    C(decay, c)                  = -0.230
Left flank, null model:
[[Model]]
    Model(constant)
[[Fit Statistics]]
    # function evals   = 6
    # data points      = 150
    # variables        = 1
    chi-square         = 0.227
    reduced chi-square = 0.002
    Akaike info crit   = -971.912
    Bayesian info crit = -968.902
[[Variables]]
    c:   0.05438283 +/- 0.003188 (5.86%) (init= 0.03)
Right flank, null model:
[[Model]]
    Model(constant)
[[Fit Statistics]]
    # function evals   = 6
    # data points      = 149
    # variables        = 1
    chi-square         = 0.222
    reduced chi-square = 0.002
    Akaike info crit   = -967.764
    Bayesian info crit = -964.760
[[Variables]]
    c:   0.05160145 +/- 0.003173 (6.15%) (init= 0.03)