H12 / Burkina Faso An. gambiae / Chromosome 2 / #7
This page describes a signal of selection found in the
Burkina Faso An. gambiae population using the
H12 (Garud et al. 20XX) statistic.The focus of this signal is on chromosome arm
2L between positions 46,000,001 and
46,040,000.
The evidence supporting this signal is
strong ( >= 100 on both flanks).
Signal location. Blue markers show the values of the selection statistic. The dashed black line shows the fitted peak model. The shaded red area shows the focus of the selection signal. The shaded blue area shows the genomic region in linkage with the selection event. Use the mouse wheel or the controls at the top right of the plot to zoom in, and hover over genes to see gene names and descriptions.
Genes
The following 6 genes overlap the focal region: AGAP007353 (phosphatidylinositol transfer protein SEC14), AGAP007354 (phosphatidylinositol transfer protein SEC14), AGAP007355 (cellular retinaldehyde binding protein), AGAP007356 (cellular retinaldehyde binding protein), AGAP007357 (retinaldehyde-binding protein 1-like protein 1), AGAP007358 (cellular retinaldehyde binding protein).
The following 14 genes are within 50 kbp of the focal region: AGAP007343 (LYSC2 - C-type lysozyme), AGAP007344 (LYSC8 - C-type lysozyme), AGAP007345 (LYSC3 - C-type lysozyme), AGAP007346 (LYSC5 - C-type lysozyme), AGAP007347 (LYSC1 - C-type lysozyme), AGAP007348 (coiled-coil domain-containing protein 102A), AGAP007349, AGAP007359, AGAP007361 (translocation protein SEC63), AGAP007362 (SH3 domain-binding glutamic acid-rich-like protein 3), AGAP007363, AGAP007364, AGAP007365, AGAP007366.
Key to insecticide resistance candidate gene types: 1 metabolic; 2 target-site; 3 behavioural; 4 cuticular.
Diagnostics
The information below provides some diagnostics from the Peak modelling algorithm.
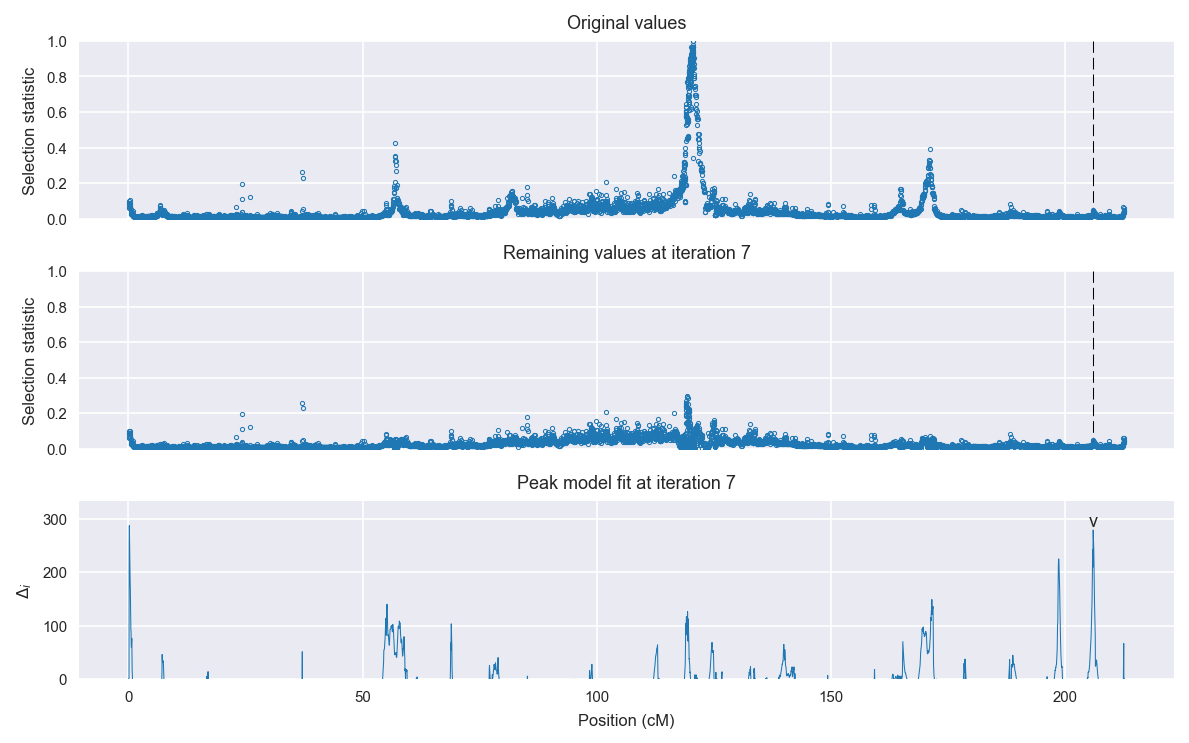
Selection signal in context. @@TODO
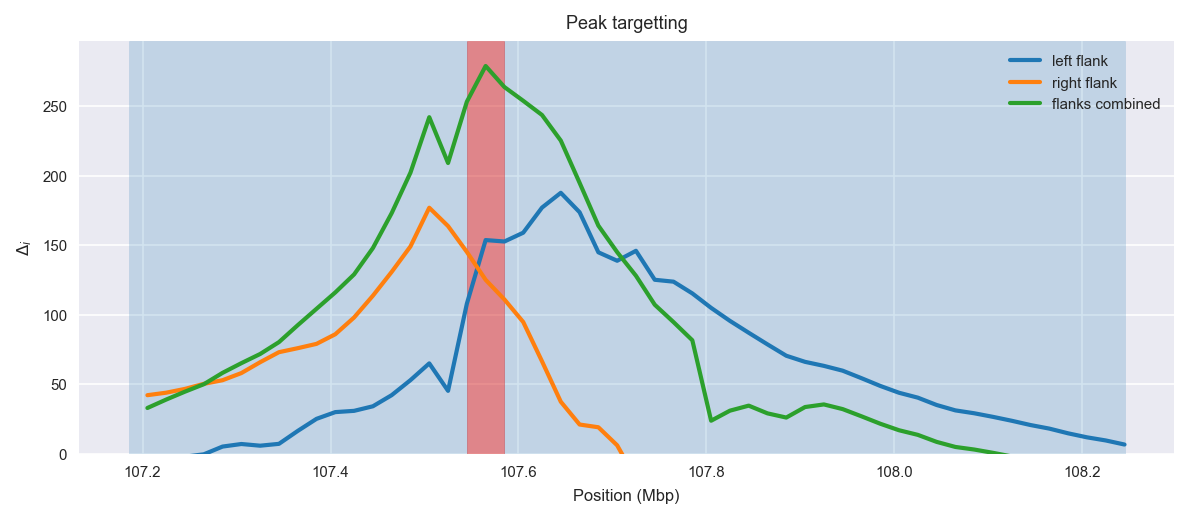
Peak targetting. @@TODO
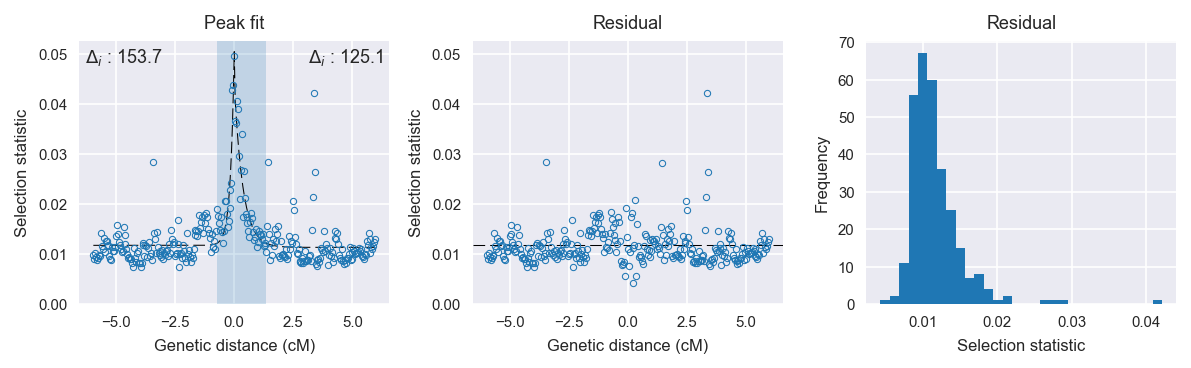
Peak fitting diagnostics. @@TODO
Model fit reports
Left flank, peak model:
[[Model]]
    Model(exponential)
[[Fit Statistics]]
    # function evals   = 51
    # data points      = 150
    # variables        = 3
    chi-square         = 0.001
    reduced chi-square = 0.000
    Akaike info crit   = -1733.554
    Bayesian info crit = -1724.522
[[Variables]]
    amplitude:   0.03869341 +/- 0.002429 (6.28%) (init= 0.5)
    decay:       0.16183573 +/- 0.016628 (10.28%) (init= 0.5)
    c:           0.01170220 +/- 0.000265 (2.26%) (init= 0.03)
    cap:         1 (fixed)
[[Correlations]] (unreported correlations are <  0.100)
    C(amplitude, decay)          = -0.587
    C(decay, c)                  = -0.239
Right flank, peak model:
[[Model]]
    Model(exponential)
[[Fit Statistics]]
    # function evals   = 31
    # data points      = 149
    # variables        = 3
    chi-square         = 0.002
    reduced chi-square = 0.000
    Akaike info crit   = -1633.095
    Bayesian info crit = -1624.083
[[Variables]]
    amplitude:   0.03258375 +/- 0.003041 (9.34%) (init= 0.5)
    decay:       0.36907402 +/- 0.049743 (13.48%) (init= 0.5)
    c:           0.01129915 +/- 0.000389 (3.45%) (init= 0.03)
    cap:         1 (fixed)
[[Correlations]] (unreported correlations are <  0.100)
    C(amplitude, decay)          = -0.701
    C(decay, c)                  = -0.376
Left flank, null model:
[[Model]]
    Model(constant)
[[Fit Statistics]]
    # function evals   = 6
    # data points      = 149
    # variables        = 1
    chi-square         = 0.004
    reduced chi-square = 0.000
    Akaike info crit   = -1579.873
    Bayesian info crit = -1576.869
[[Variables]]
    c:   0.01263363 +/- 0.000407 (3.22%) (init= 0.03)
Right flank, null model:
[[Model]]
    Model(constant)
[[Fit Statistics]]
    # function evals   = 6
    # data points      = 148
    # variables        = 1
    chi-square         = 0.005
    reduced chi-square = 0.000
    Akaike info crit   = -1507.989
    Bayesian info crit = -1504.992
[[Variables]]
    c:   0.01301404 +/- 0.000502 (3.86%) (init= 0.03)