H12 / Gabon An. gambiae / Chromosome 2 / #1
This page describes a signal of selection found in the
Gabon An. gambiae population using the
H12 (Garud et al. 20XX) statistic.The focus of this signal is on chromosome arm
2L between positions 25,460,001 and
25,520,000.
The evidence supporting this signal is
strong ( >= 100 on both flanks).
Signal location. Blue markers show the values of the selection statistic. The dashed black line shows the fitted peak model. The shaded red area shows the focus of the selection signal. The shaded blue area shows the genomic region in linkage with the selection event. Use the mouse wheel or the controls at the top right of the plot to zoom in, and hover over genes to see gene names and descriptions.
Genes
The following 7 genes overlap the focal region: AGAP006030 (mfrn - mitoferrin), AGAP006031 (nuclear pore complex protein Nup54), AGAP006032, AGAP006033, AGAP006034, AGAP006035 (Ras-related protein Rab-36), AGAP006036 (axonemal dynein intermediate chain inner arm i1).
The following 9 genes are within 50 kbp of the focal region: AGAP0060282 (Rdl - GABA-gated chloride channel subunit), AGAP006029, AGAP006037 (RpL24 - 60S ribosomal protein L24), AGAP006038 (serine/arginine repetitive matrix protein 2), AGAP006039, AGAP006040 (peroxisomal membrane protein 2), AGAP006041 (E3 ubiquitin-protein ligase RNF5), AGAP006042, AGAP029130.
Key to insecticide resistance candidate gene types: 1 metabolic; 2 target-site; 3 behavioural; 4 cuticular.
Overlapping signals
The following selection signals have a focus which overlaps with the focus of this signal.
| Signal | Focus | Score (Left | Right) |
|---|---|---|
| H12 / Burkina Faso An. coluzzii / Chromosome 2 / #2 | 2L:25,400,001-25,520,000 | 919 (426 | 492) |
Diagnostics
The information below provides some diagnostics from the Peak modelling algorithm.
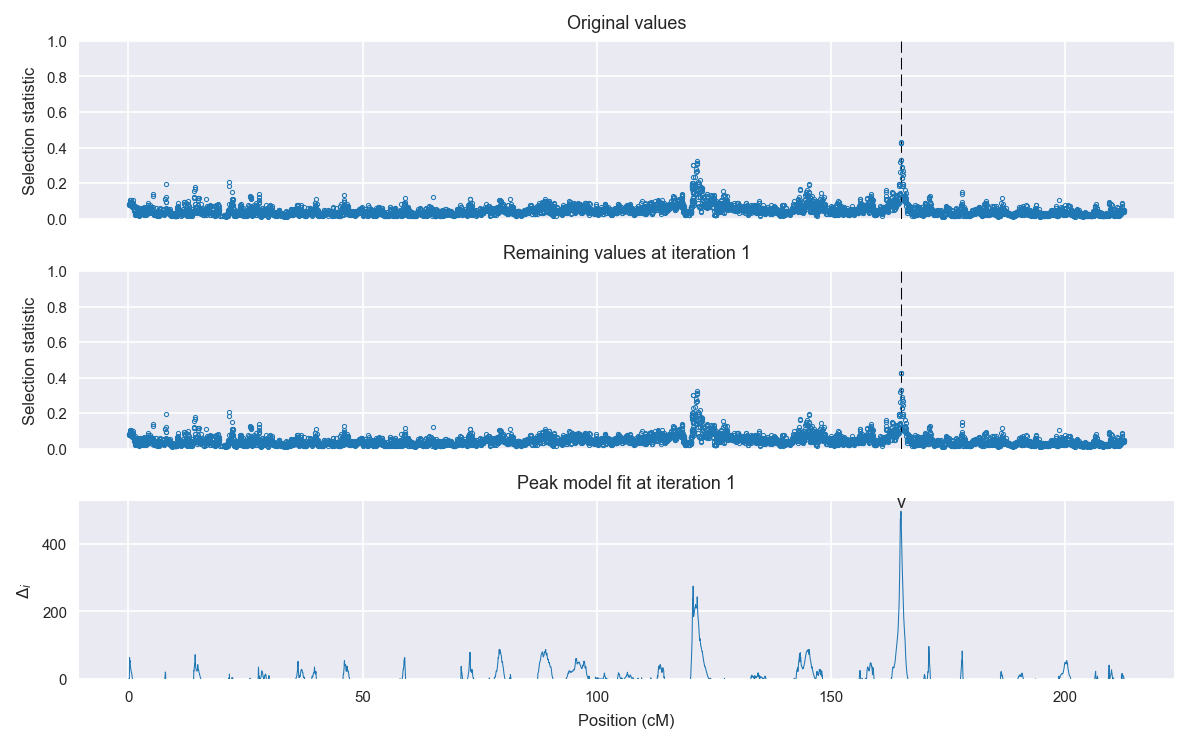
Selection signal in context. @@TODO
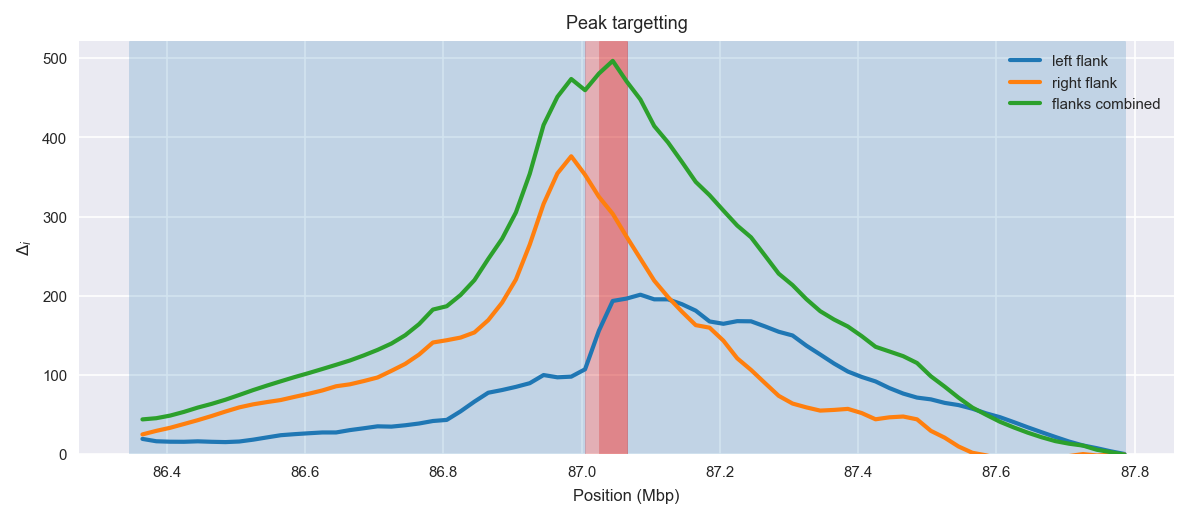
Peak targetting. @@TODO
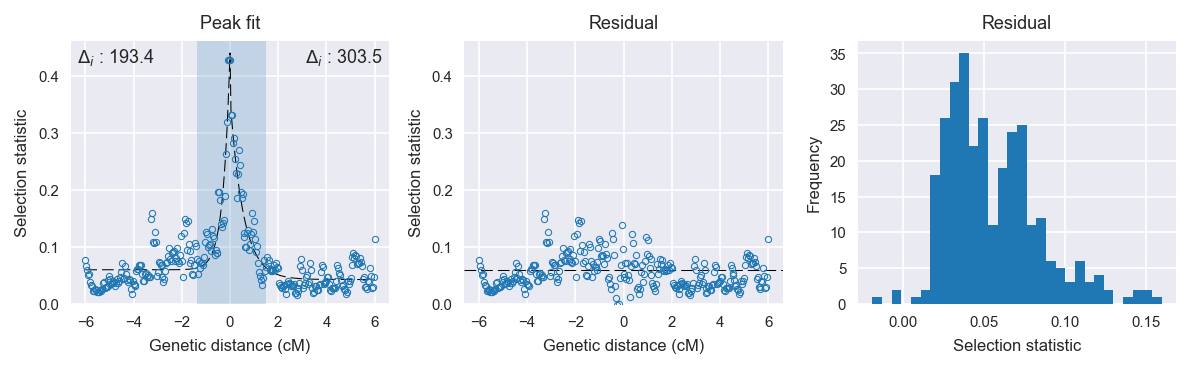
Peak fitting diagnostics. @@TODO
Model fit reports
Left flank, peak model:
[[Model]]
    Model(exponential)
[[Fit Statistics]]
    # function evals   = 53
    # data points      = 151
    # variables        = 3
    chi-square         = 0.161
    reduced chi-square = 0.001
    Akaike info crit   = -1027.551
    Bayesian info crit = -1018.499
[[Variables]]
    amplitude:   0.38116350 +/- 0.021523 (5.65%) (init= 0.5)
    decay:       0.28843181 +/- 0.026043 (9.03%) (init= 0.5)
    c:           0.05999996 +/- 0.002984 (4.97%) (init= 0.03)
    cap:         1 (fixed)
[[Correlations]] (unreported correlations are <  0.100)
    C(amplitude, decay)          = -0.610
    C(decay, c)                  = -0.325
Right flank, peak model:
[[Model]]
    Model(exponential)
[[Fit Statistics]]
    # function evals   = 19
    # data points      = 150
    # variables        = 3
    chi-square         = 0.072
    reduced chi-square = 0.000
    Akaike info crit   = -1141.152
    Bayesian info crit = -1132.120
[[Variables]]
    amplitude:   0.31922745 +/- 0.012870 (4.03%) (init= 0.5)
    decay:       0.54684409 +/- 0.034062 (6.23%) (init= 0.5)
    c:           0.04289024 +/- 0.002260 (5.27%) (init= 0.03)
    cap:         1 (fixed)
[[Correlations]] (unreported correlations are <  0.100)
    C(amplitude, decay)          = -0.658
    C(decay, c)                  = -0.472
Left flank, null model:
[[Model]]
    Model(constant)
[[Fit Statistics]]
    # function evals   = 6
    # data points      = 150
    # variables        = 1
    chi-square         = 0.569
    reduced chi-square = 0.004
    Akaike info crit   = -834.177
    Bayesian info crit = -831.166
[[Variables]]
    c:   0.07928571 +/- 0.005045 (6.36%) (init= 0.03)
Right flank, null model:
[[Model]]
    Model(constant)
[[Fit Statistics]]
    # function evals   = 6
    # data points      = 149
    # variables        = 1
    chi-square         = 0.532
    reduced chi-square = 0.004
    Akaike info crit   = -837.676
    Bayesian info crit = -834.672
[[Variables]]
    c:   0.06918037 +/- 0.004910 (7.10%) (init= 0.03)