H12 / Gabon An. gambiae / Chromosome X / #1
This page describes a signal of selection found in the
Gabon An. gambiae population using the
H12 (Garud et al. 20XX) statistic.The focus of this signal is on chromosome arm
X between positions 14,480,001 and
14,720,000.
The evidence supporting this signal is
weak ( < 50 on one or both flanks).
Signal location. Blue markers show the values of the selection statistic. The dashed black line shows the fitted peak model. The shaded red area shows the focus of the selection signal. The shaded blue area shows the genomic region in linkage with the selection event. Use the mouse wheel or the controls at the top right of the plot to zoom in, and hover over genes to see gene names and descriptions.
Genes
The following 4 genes overlap the focal region: AGAP000795, AGAP000797 (E3 ubiquitin-protein ligase HECW2), AGAP0007982 (GLURIIc - ionotropic receptor GLURIIc), AGAP0008012 (GLURIIb - ionotropic receptor GLURIIb).
The following 7 genes are within 50 kbp of the focal region: AGAP000792 (Adenosylhomocysteinase), AGAP000793, AGAP0007941 (NADH dehydrogenase (ubiquinone) Fe-S protein 2), AGAP013289, AGAP0008032 (GLURIIa - ionotropic receptor GLURIIa), AGAP0008041 (GPXH2 - glutathione peroxidase 2), AGAP000805 (BTB/POZ domain-containing protein KCTD16).
Key to insecticide resistance candidate gene types: 1 metabolic; 2 target-site; 3 behavioural; 4 cuticular.
Overlapping signals
The following selection signals have a focus which overlaps with the focus of this signal.
| Signal | Focus | Score (Left | Right) |
|---|---|---|
| H12 / Angola An. coluzzii / Chromosome X / #2 | X:14,660,001-14,720,000 | 262 (204 | 58) |
Diagnostics
The information below provides some diagnostics from the Peak modelling algorithm.
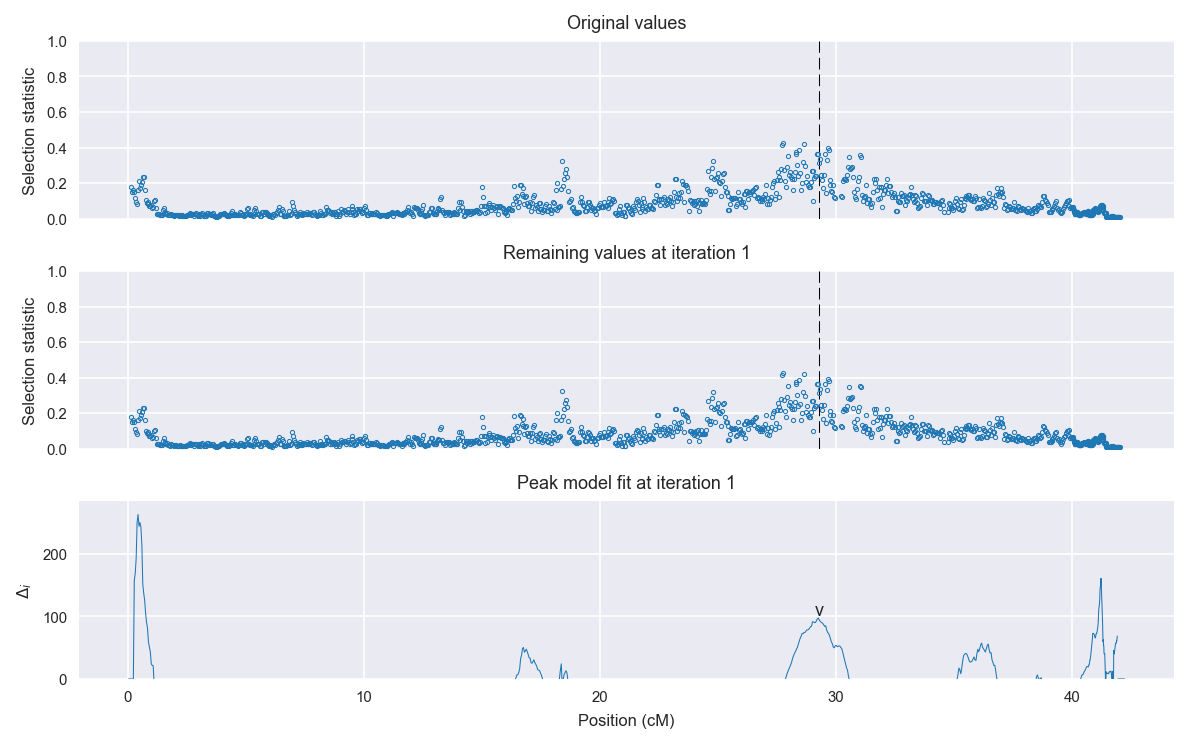
Selection signal in context. @@TODO
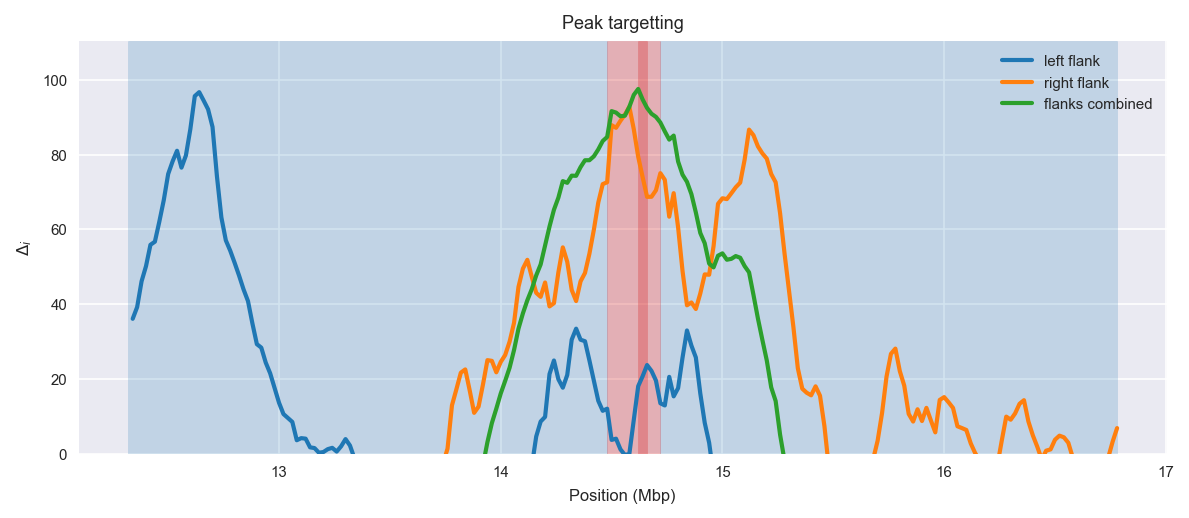
Peak targetting. @@TODO
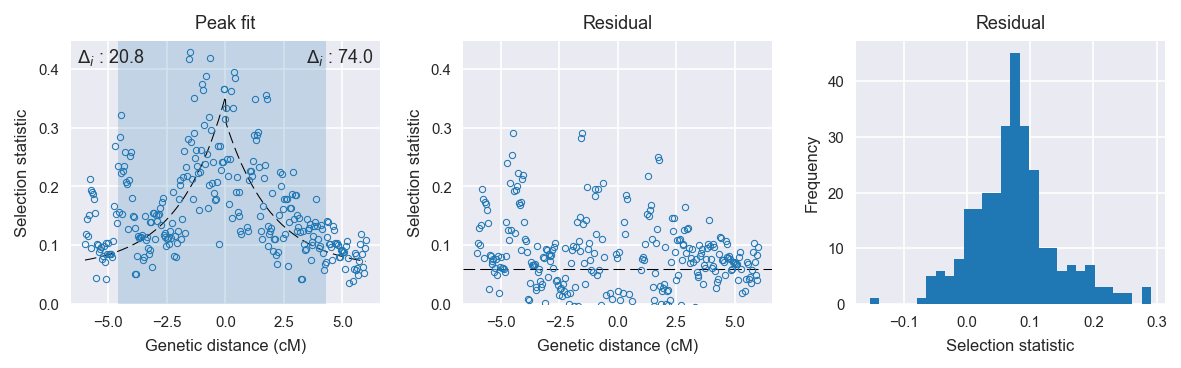
Peak fitting diagnostics. @@TODO
Model fit reports
Left flank, peak model:
[[Model]]
    Model(exponential)
[[Fit Statistics]]
    # function evals   = 124
    # data points      = 151
    # variables        = 3
    chi-square         = 0.899
    reduced chi-square = 0.006
    Akaike info crit   = -767.687
    Bayesian info crit = -758.635
[[Variables]]
    amplitude:   0.29296462 +/- 0.024707 (8.43%) (init= 0.5)
    decay:       1.99999978 +/- 0.395854 (19.79%) (init= 0.5)
    c:           0.05999999 +/- 0.029358 (48.93%) (init= 0.03)
    cap:         1 (fixed)
[[Correlations]] (unreported correlations are <  0.100)
    C(decay, c)                  =  0.904
    C(amplitude, c)              =  0.457
    C(amplitude, decay)          =  0.144
Right flank, peak model:
[[Model]]
    Model(exponential)
[[Fit Statistics]]
    # function evals   = 80
    # data points      = 141
    # variables        = 3
    chi-square         = 0.457
    reduced chi-square = 0.003
    Akaike info crit   = -802.329
    Bayesian info crit = -793.482
[[Variables]]
    amplitude:   0.25113155 +/- 0.019553 (7.79%) (init= 0.5)
    decay:       2          +/- 0.460004 (23.00%) (init= 0.5)
    c:           0.05999999 +/- 0.018011 (30.02%) (init= 0.03)
    cap:         1 (fixed)
[[Correlations]] (unreported correlations are <  0.100)
    C(decay, c)                  = -0.906
    C(amplitude, c)              = -0.444
    C(amplitude, decay)          =  0.132
Left flank, null model:
[[Model]]
    Model(constant)
[[Fit Statistics]]
    # function evals   = 6
    # data points      = 150
    # variables        = 1
    chi-square         = 1.018
    reduced chi-square = 0.007
    Akaike info crit   = -746.919
    Bayesian info crit = -743.908
[[Variables]]
    c:   0.17340774 +/- 0.006748 (3.89%) (init= 0.03)
Right flank, null model:
[[Model]]
    Model(constant)
[[Fit Statistics]]
    # function evals   = 6
    # data points      = 140
    # variables        = 1
    chi-square         = 0.759
    reduced chi-square = 0.005
    Akaike info crit   = -728.376
    Bayesian info crit = -725.434
[[Variables]]
    c:   0.14301316 +/- 0.006246 (4.37%) (init= 0.03)