H12 / Guinea An. gambiae / Chromosome 2 / #3
This page describes a signal of selection found in the
Guinea An. gambiae population using the
H12 (Garud et al. 20XX) statistic.The focus of this signal is on chromosome arm
2L between positions 28,760,001 and
28,920,000.
The evidence supporting this signal is
moderate ( >= 50 on both flanks).
Signal location. Blue markers show the values of the selection statistic. The dashed black line shows the fitted peak model. The shaded red area shows the focus of the selection signal. The shaded blue area shows the genomic region in linkage with the selection event. Use the mouse wheel or the controls at the top right of the plot to zoom in, and hover over genes to see gene names and descriptions.
Genes
The following 6 genes overlap the focal region: AGAP006263 (ARR2 - arrestin Arr2-like), AGAP006264 (Peroxisomal targeting signal 2 receptor), AGAP006265, AGAP006266 (HIV Tat-specific factor 1), AGAP006267 (CTL6 - C-type lectin (CTL)), AGAP006268.
The following 6 genes are within 50 kbp of the focal region: AGAP006260 (Z band alternatively spliced PDZ-motif protein 66), AGAP0062614 (CPR135 - cuticular protein RR-2 family 135), AGAP006262, AGAP006269 (phosphatidylinositol glycan, class O), AGAP006270 (fyn-related kinase), AGAP006271.
Key to insecticide resistance candidate gene types: 1 metabolic; 2 target-site; 3 behavioural; 4 cuticular.
Diagnostics
The information below provides some diagnostics from the Peak modelling algorithm.
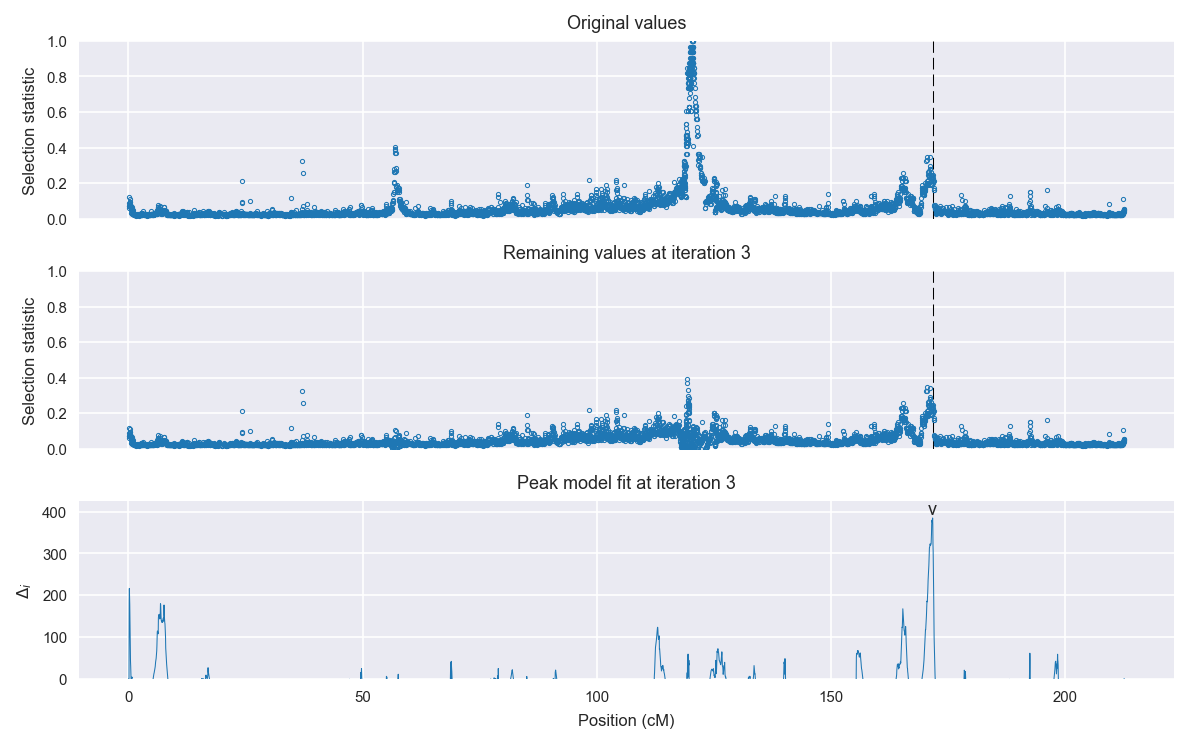
Selection signal in context. @@TODO
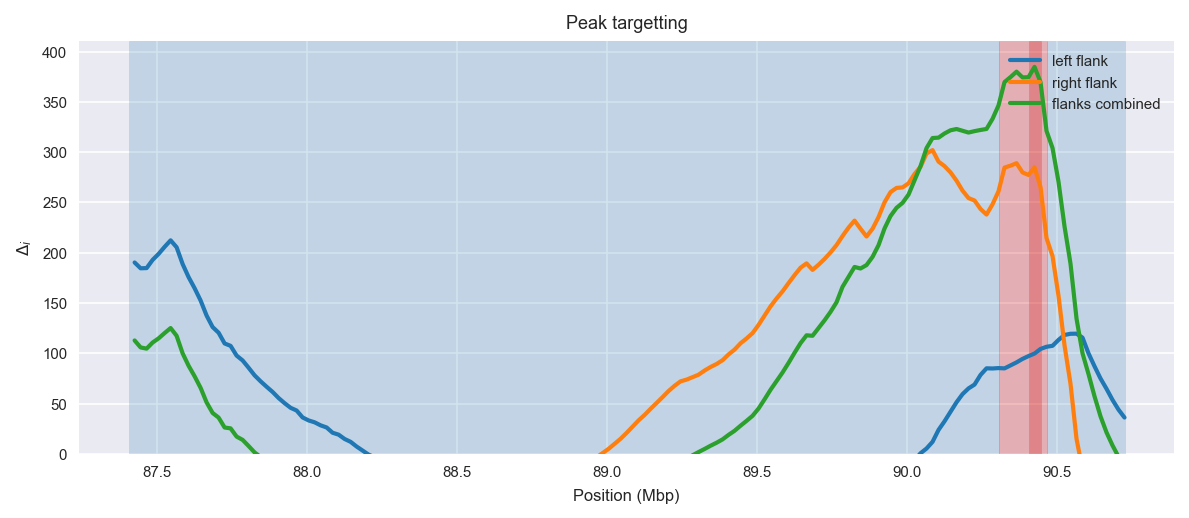
Peak targetting. @@TODO
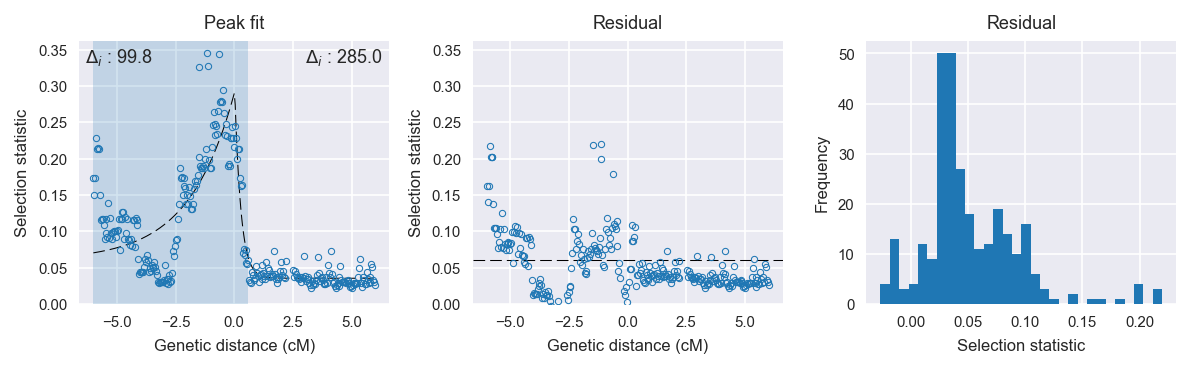
Peak fitting diagnostics. @@TODO
Model fit reports
Left flank, peak model:
[[Model]]
    Model(exponential)
[[Fit Statistics]]
    # function evals   = 113
    # data points      = 151
    # variables        = 3
    chi-square         = 0.454
    reduced chi-square = 0.003
    Akaike info crit   = -870.751
    Bayesian info crit = -861.699
[[Variables]]
    amplitude:   0.22994987 +/- 0.017427 (7.58%) (init= 0.5)
    decay:       1.93212655 +/- 0.442230 (22.89%) (init= 0.5)
    c:           0.05999999 +/- 0.000400 (0.67%) (init= 0.03)
    cap:         1 (fixed)
[[Correlations]] (unreported correlations are <  0.100)
    C(decay, c)                  =  0.897
    C(amplitude, c)              =  0.416
Right flank, peak model:
[[Model]]
    Model(exponential)
[[Fit Statistics]]
    # function evals   = 23
    # data points      = 143
    # variables        = 3
    chi-square         = 0.026
    reduced chi-square = 0.000
    Akaike info crit   = -1227.100
    Bayesian info crit = -1218.212
[[Variables]]
    amplitude:   0.27867877 +/- 0.012445 (4.47%) (init= 0.5)
    decay:       0.26192087 +/- 0.016120 (6.15%) (init= 0.5)
    c:           0.03534786 +/- 0.001254 (3.55%) (init= 0.03)
    cap:         1 (fixed)
[[Correlations]] (unreported correlations are <  0.100)
    C(amplitude, decay)          = -0.730
    C(decay, c)                  = -0.317
Left flank, null model:
[[Model]]
    Model(constant)
[[Fit Statistics]]
    # function evals   = 6
    # data points      = 150
    # variables        = 1
    chi-square         = 0.867
    reduced chi-square = 0.006
    Akaike info crit   = -770.975
    Bayesian info crit = -767.964
[[Variables]]
    c:   0.13332639 +/- 0.006228 (4.67%) (init= 0.03)
Right flank, null model:
[[Model]]
    Model(constant)
[[Fit Statistics]]
    # function evals   = 6
    # data points      = 142
    # variables        = 1
    chi-square         = 0.184
    reduced chi-square = 0.001
    Akaike info crit   = -942.140
    Bayesian info crit = -939.184
[[Variables]]
    c:   0.04576732 +/- 0.003031 (6.62%) (init= 0.03)