H12 / Guinea An. gambiae / Chromosome 2 / #4
This page describes a signal of selection found in the
Guinea An. gambiae population using the
H12 (Garud et al. 20XX) statistic.The focus of this signal is on chromosome arm
2L between positions 25,660,001 and
25,760,000.
The evidence supporting this signal is
moderate ( >= 50 on both flanks).
Signal location. Blue markers show the values of the selection statistic. The dashed black line shows the fitted peak model. The shaded red area shows the focus of the selection signal. The shaded blue area shows the genomic region in linkage with the selection event. Use the mouse wheel or the controls at the top right of the plot to zoom in, and hover over genes to see gene names and descriptions.
Genes
The following 7 genes overlap the focal region: AGAP006052 (protein phosphatase 1, regulatory (inhibitor) subunit 3), AGAP006053, AGAP006054, AGAP006055 (NF-kappa-B inhibitor-like protein 2), AGAP006056, AGAP006057 (multiple coagulation factor deficiency 2), AGAP006058 (heparan sulfate 2-o-sulfotransferase).
The following 8 genes are within 50 kbp of the focal region: AGAP006045 (protein yorkie), AGAP006046 (Med23 - mediator of RNA polymerase II transcription subunit 23), AGAP0060471 (CYP4J9 - cytochrome P450), AGAP0060481 (CYP4J5 - cytochrome P450), AGAP0060491 (CYP4J10 - cytochrome P450), AGAP006050 (AarF domain containing kinase 5), AGAP006051 (pentatricopeptide repeat domain 1), AGAP006059.
Key to insecticide resistance candidate gene types: 1 metabolic; 2 target-site; 3 behavioural; 4 cuticular.
Diagnostics
The information below provides some diagnostics from the Peak modelling algorithm.
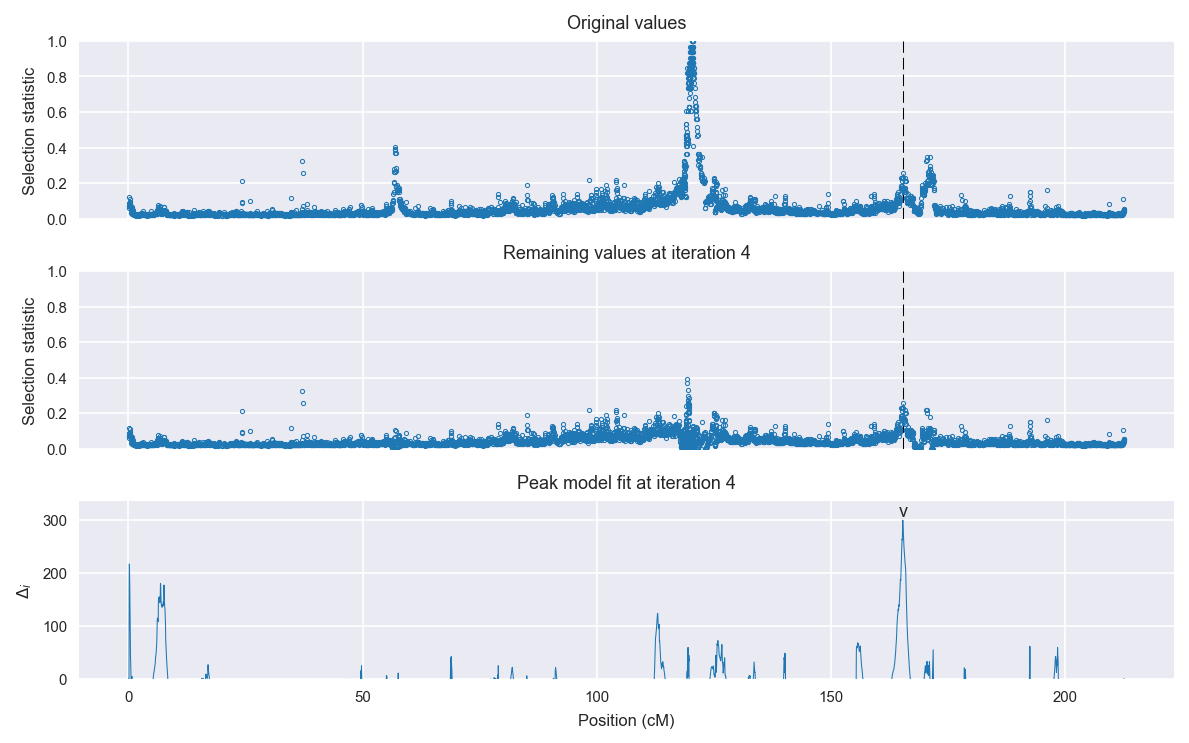
Selection signal in context. @@TODO
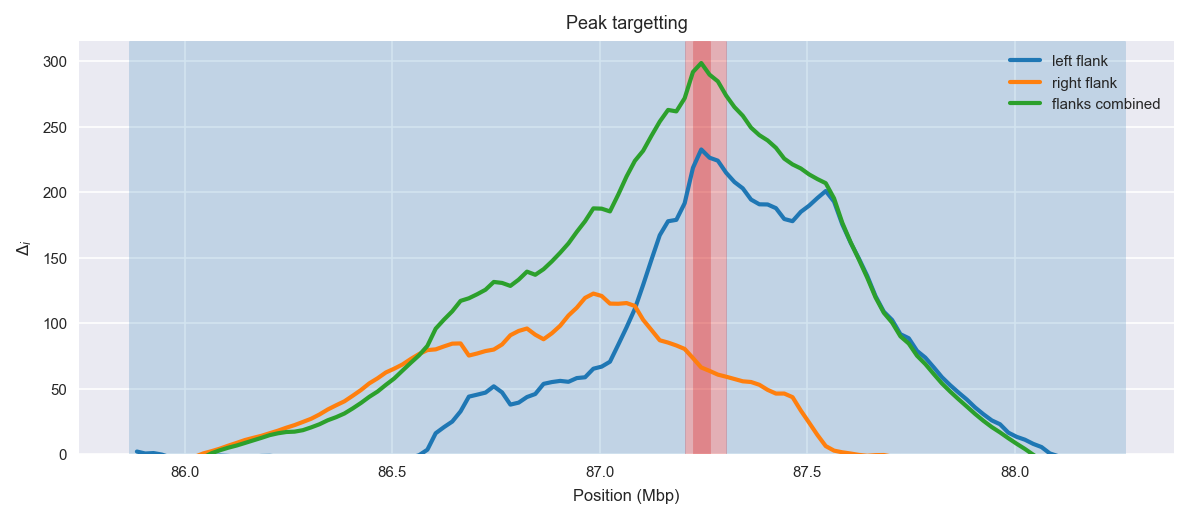
Peak targetting. @@TODO
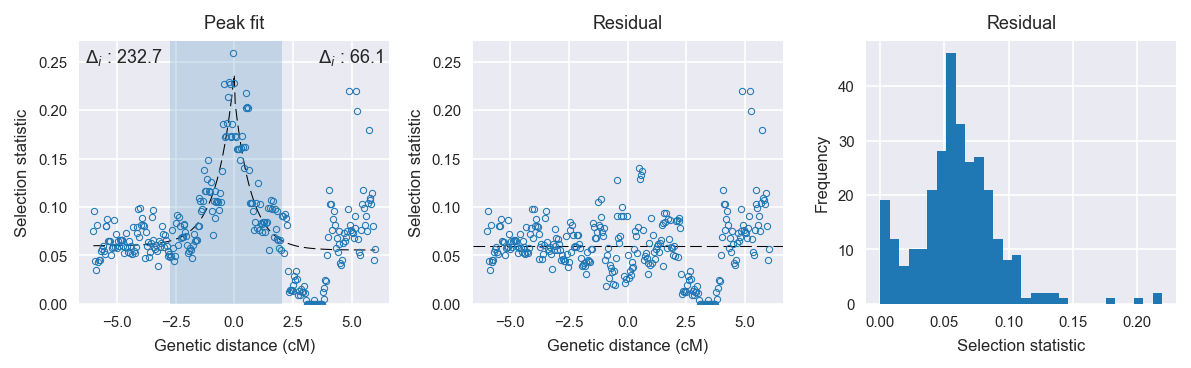
Peak fitting diagnostics. @@TODO
Model fit reports
Left flank, peak model:
[[Model]]
    Model(exponential)
[[Fit Statistics]]
    # function evals   = 51
    # data points      = 151
    # variables        = 3
    chi-square         = 0.055
    reduced chi-square = 0.000
    Akaike info crit   = -1190.763
    Bayesian info crit = -1181.711
[[Variables]]
    amplitude:   0.17692286 +/- 0.008345 (4.72%) (init= 0.5)
    decay:       0.76517577 +/- 0.064104 (8.38%) (init= 0.5)
    c:           0.05999999 +/- 0.002231 (3.72%) (init= 0.03)
    cap:         1 (fixed)
[[Correlations]] (unreported correlations are <  0.100)
    C(decay, c)                  = -0.577
    C(amplitude, decay)          = -0.543
Right flank, peak model:
[[Model]]
    Model(exponential)
[[Fit Statistics]]
    # function evals   = 43
    # data points      = 150
    # variables        = 3
    chi-square         = 0.276
    reduced chi-square = 0.002
    Akaike info crit   = -938.889
    Bayesian info crit = -929.858
[[Variables]]
    amplitude:   0.15950485 +/- 0.021499 (13.48%) (init= 0.5)
    decay:       0.72685933 +/- 0.162885 (22.41%) (init= 0.5)
    c:           0.05559313 +/- 0.004913 (8.84%) (init= 0.03)
    cap:         1 (fixed)
[[Correlations]] (unreported correlations are <  0.100)
    C(amplitude, decay)          = -0.614
    C(decay, c)                  = -0.563
Left flank, null model:
[[Model]]
    Model(constant)
[[Fit Statistics]]
    # function evals   = 6
    # data points      = 150
    # variables        = 1
    chi-square         = 0.249
    reduced chi-square = 0.002
    Akaike info crit   = -958.054
    Bayesian info crit = -955.043
[[Variables]]
    c:   0.08328130 +/- 0.003338 (4.01%) (init= 0.03)
Right flank, null model:
[[Model]]
    Model(constant)
[[Fit Statistics]]
    # function evals   = 6
    # data points      = 149
    # variables        = 1
    chi-square         = 0.420
    reduced chi-square = 0.003
    Akaike info crit   = -872.827
    Bayesian info crit = -869.823
[[Variables]]
    c:   0.07340815 +/- 0.004364 (5.95%) (init= 0.03)