H12 / Guinea Bissau / Chromosome 3 / #1
This page describes a signal of selection found in the
Guinea Bissau population using the
H12 (Garud et al. 20XX) statistic.The focus of this signal is on chromosome arm
3R between positions 49,320,001 and
49,380,000.
The evidence supporting this signal is
weak ( < 50 on one or both flanks).
Signal location. Blue markers show the values of the selection statistic. The dashed black line shows the fitted peak model. The shaded red area shows the focus of the selection signal. The shaded blue area shows the genomic region in linkage with the selection event. Use the mouse wheel or the controls at the top right of the plot to zoom in, and hover over genes to see gene names and descriptions.
Genes
The following 6 genes overlap the focal region: AGAP010137 (adenosine kinase), AGAP010138 (uncharacterized protein yjbQ), AGAP010139 (GMP synthase (glutamine-hydrolysing)), AGAP010140 (hydrolases of HD superfamily), AGAP010141 (DnaJ homolog subfamily C member 4), AGAP010142 (Dat - dopamine N-acetyltransferase).
The following 9 genes are within 50 kbp of the focal region: AGAP010131 (ornithine decarboxylase antizyme 1), AGAP010132 (SCRBQ1 - Class B Scavenger Receptor (CD36 domain).), AGAP010133 (SCRPQ2 - Class B Scavenger Receptor (CD36 domain).), AGAP010134 (arrestin-1), AGAP010135 (NCK adaptor protein), AGAP010136, AGAP010143, AGAP010144, AGAP010145 (yellow).
Key to insecticide resistance candidate gene types: 1 metabolic; 2 target-site; 3 behavioural; 4 cuticular.
Diagnostics
The information below provides some diagnostics from the Peak modelling algorithm.
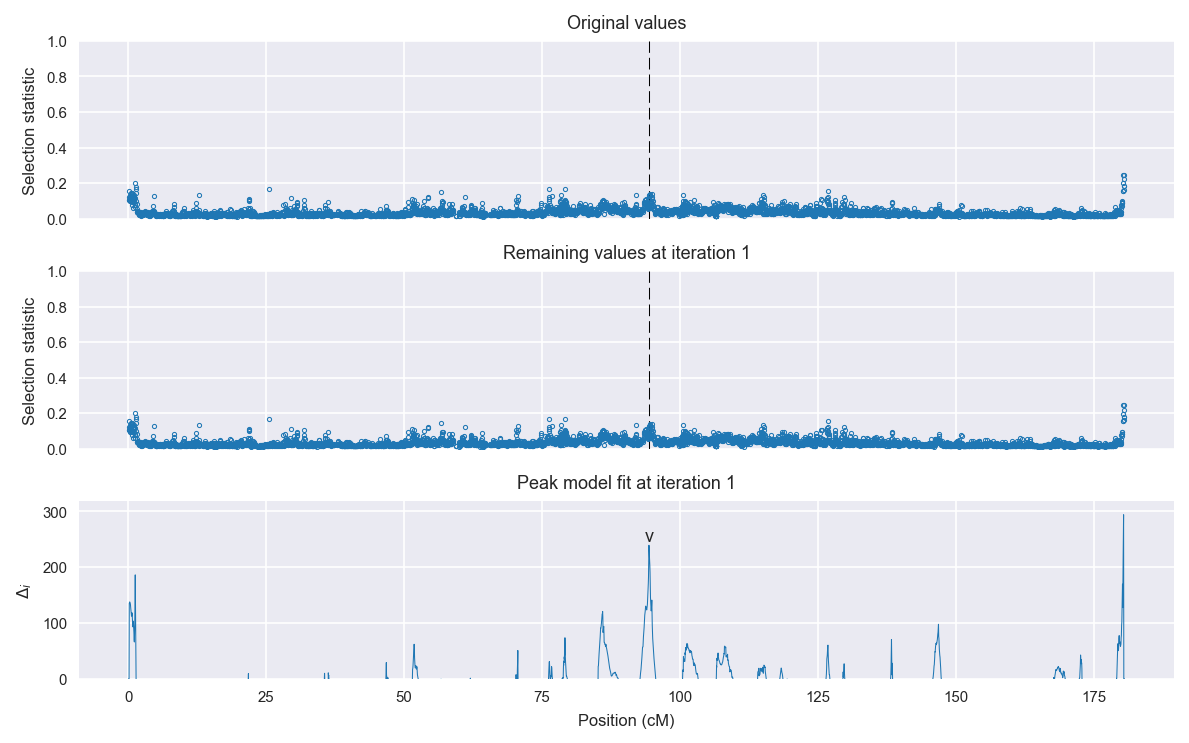
Selection signal in context. @@TODO
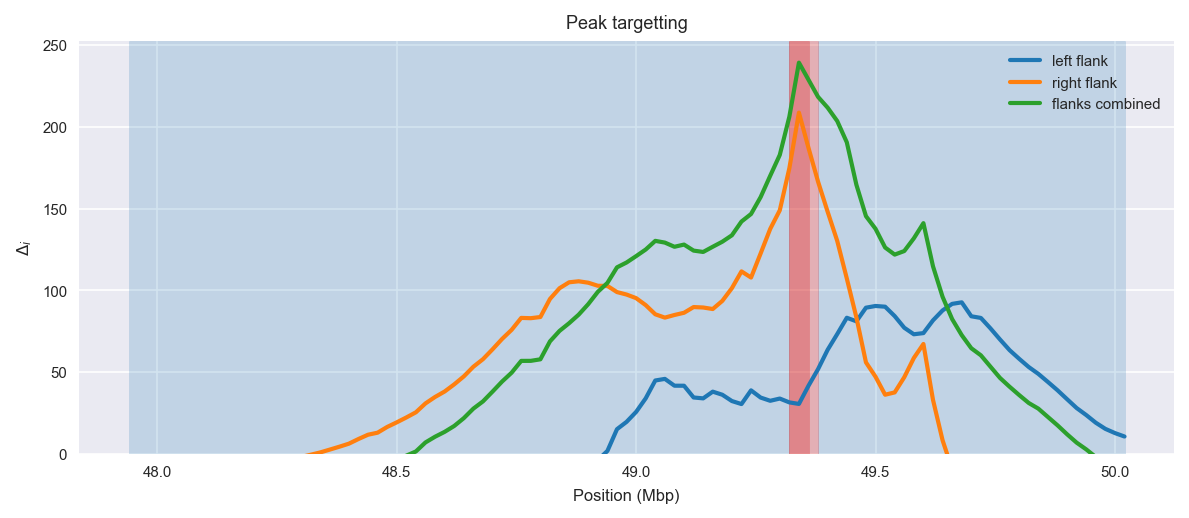
Peak targetting. @@TODO
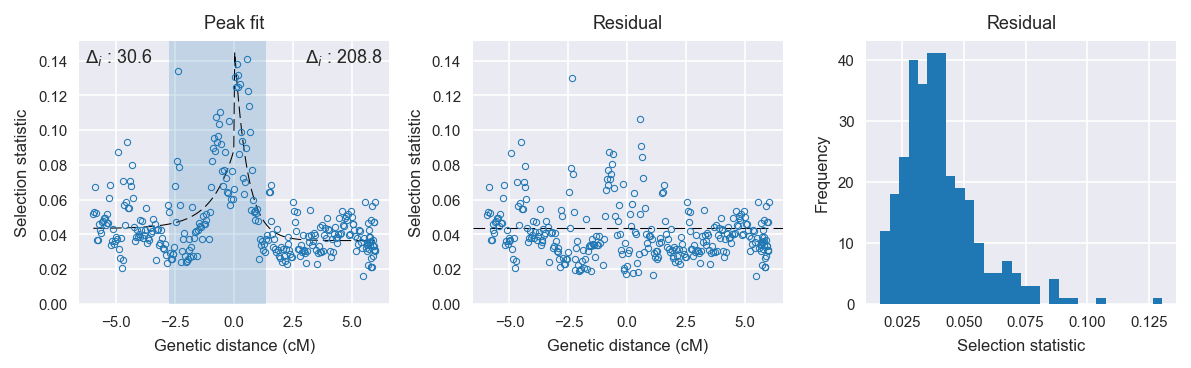
Peak fitting diagnostics. @@TODO
Model fit reports
Left flank, peak model:
[[Model]]
    Model(exponential)
[[Fit Statistics]]
    # function evals   = 34
    # data points      = 145
    # variables        = 3
    chi-square         = 0.049
    reduced chi-square = 0.000
    Akaike info crit   = -1153.034
    Bayesian info crit = -1144.103
[[Variables]]
    amplitude:   0.04484299 +/- 0.007361 (16.42%) (init= 0.5)
    decay:       0.95612138 +/- 0.306166 (32.02%) (init= 0.5)
    c:           0.04342372 +/- 0.002485 (5.72%) (init= 0.03)
    cap:         1 (fixed)
[[Correlations]] (unreported correlations are <  0.100)
    C(decay, c)                  = -0.666
    C(amplitude, decay)          = -0.475
Right flank, peak model:
[[Model]]
    Model(exponential)
[[Fit Statistics]]
    # function evals   = 27
    # data points      = 170
    # variables        = 3
    chi-square         = 0.027
    reduced chi-square = 0.000
    Akaike info crit   = -1480.398
    Bayesian info crit = -1470.991
[[Variables]]
    amplitude:   0.11679913 +/- 0.007457 (6.39%) (init= 0.5)
    decay:       0.54337097 +/- 0.052529 (9.67%) (init= 0.5)
    c:           0.03642745 +/- 0.001185 (3.25%) (init= 0.03)
    cap:         1 (fixed)
[[Correlations]] (unreported correlations are <  0.100)
    C(amplitude, decay)          = -0.670
    C(decay, c)                  = -0.436
Left flank, null model:
[[Model]]
    Model(constant)
[[Fit Statistics]]
    # function evals   = 6
    # data points      = 144
    # variables        = 1
    chi-square         = 0.058
    reduced chi-square = 0.000
    Akaike info crit   = -1122.447
    Bayesian info crit = -1119.477
[[Variables]]
    c:   0.04997637 +/- 0.001685 (3.37%) (init= 0.03)
Right flank, null model:
[[Model]]
    Model(constant)
[[Fit Statistics]]
    # function evals   = 6
    # data points      = 169
    # variables        = 1
    chi-square         = 0.090
    reduced chi-square = 0.001
    Akaike info crit   = -1271.587
    Bayesian info crit = -1268.457
[[Variables]]
    c:   0.04485548 +/- 0.001782 (3.97%) (init= 0.03)