H12 / Guinea Bissau / Chromosome 3 / #2
This page describes a signal of selection found in the
Guinea Bissau population using the
H12 (Garud et al. 20XX) statistic.The focus of this signal is on chromosome arm
3R between positions 45,080,001 and
45,160,000.
The evidence supporting this signal is
moderate ( >= 50 on both flanks).
Signal location. Blue markers show the values of the selection statistic. The dashed black line shows the fitted peak model. The shaded red area shows the focus of the selection signal. The shaded blue area shows the genomic region in linkage with the selection event. Use the mouse wheel or the controls at the top right of the plot to zoom in, and hover over genes to see gene names and descriptions.
Genes
Gene AGAP009899 overlaps the focal region.
The following 14 genes are within 50 kbp of the focal region: AGAP009901 (diphosphoinositol-polyphosphate diphosphatase), AGAP009902 (E3 ubiquitin-protein ligase RNF146), AGAP009903 (tRNA pseudouridine synthase (Fragment)), AGAP009904 (tRNA (adenine-N(1)-)-methyltransferase non-catalytic subunit), AGAP009905 (PHD finger-like domain-containing protein 5A), AGAP009906, AGAP009907 (leukotriene-A4 hydrolase), AGAP009908 (mRpL13 - 39S ribosomal protein L13, mitochondrial), AGAP009909, AGAP009910 (ATP-dependent DNA helicase 2 subunit 2), AGAP009911, AGAP009912, AGAP009913 (actin-binding protein IPP), AGAP009914 (nuclear distribution protein NudE).
Key to insecticide resistance candidate gene types: 1 metabolic; 2 target-site; 3 behavioural; 4 cuticular.
Diagnostics
The information below provides some diagnostics from the Peak modelling algorithm.
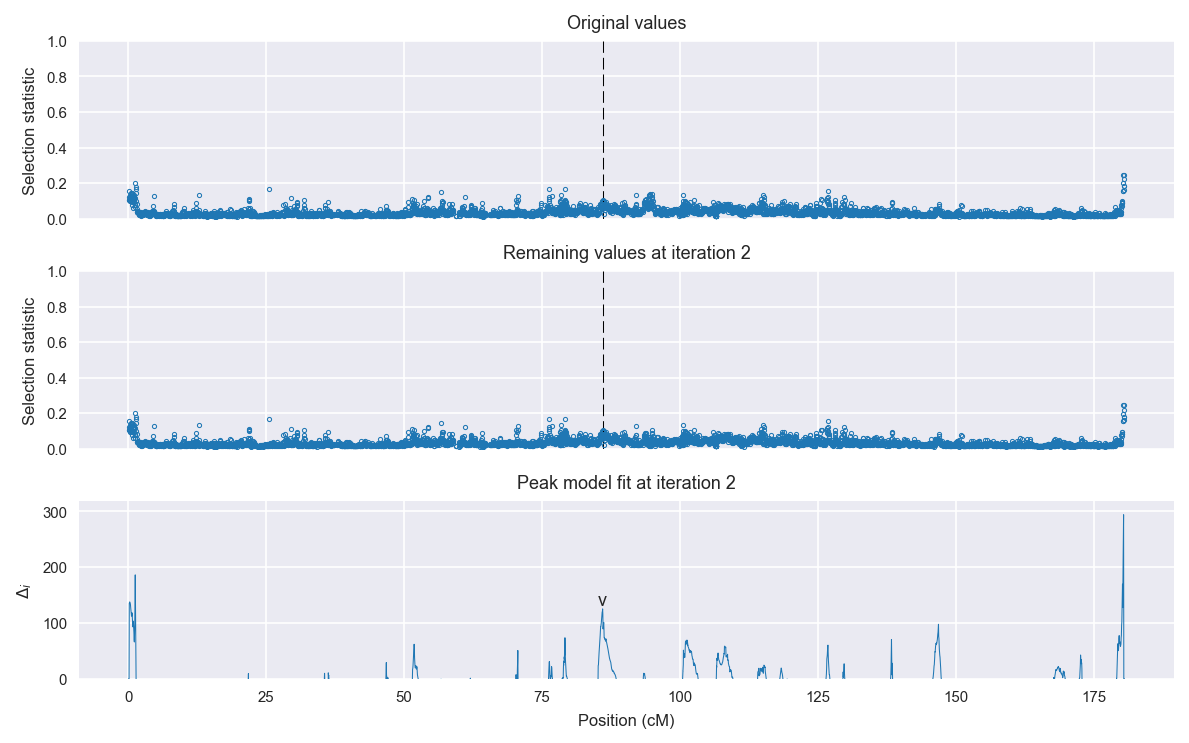
Selection signal in context. @@TODO
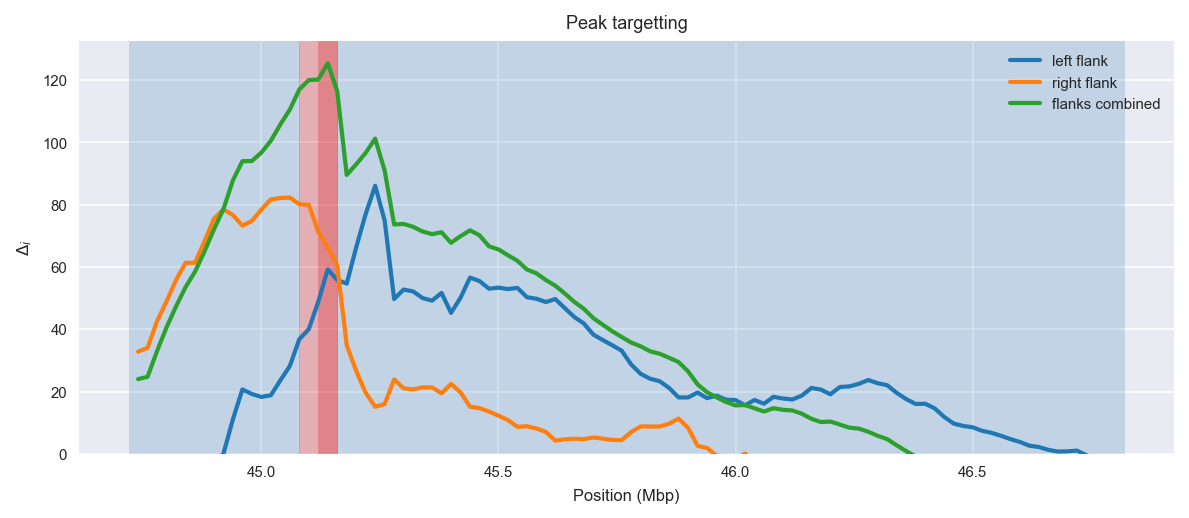
Peak targetting. @@TODO
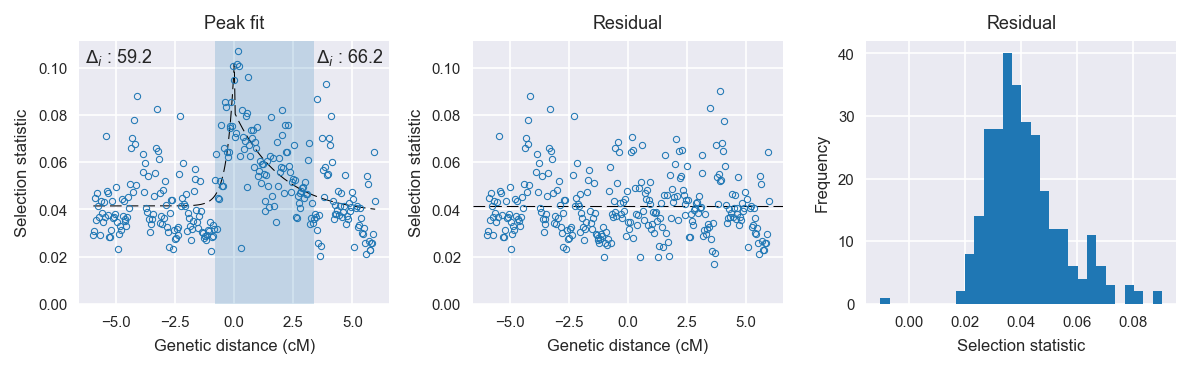
Peak fitting diagnostics. @@TODO
Model fit reports
Left flank, peak model:
[[Model]]
    Model(exponential)
[[Fit Statistics]]
    # function evals   = 71
    # data points      = 145
    # variables        = 3
    chi-square         = 0.025
    reduced chi-square = 0.000
    Akaike info crit   = -1252.378
    Bayesian info crit = -1243.448
[[Variables]]
    amplitude:   0.06016664 +/- 0.008356 (13.89%) (init= 0.5)
    decay:       0.31174724 +/- 0.069507 (22.30%) (init= 0.5)
    c:           0.04148279 +/- 0.001236 (2.98%) (init= 0.03)
    cap:         1 (fixed)
[[Correlations]] (unreported correlations are <  0.100)
    C(amplitude, decay)          = -0.607
    C(decay, c)                  = -0.347
Right flank, peak model:
[[Model]]
    Model(exponential)
[[Fit Statistics]]
    # function evals   = 39
    # data points      = 146
    # variables        = 3
    chi-square         = 0.028
    reduced chi-square = 0.000
    Akaike info crit   = -1241.331
    Bayesian info crit = -1232.380
[[Variables]]
    amplitude:   0.04335692 +/- 0.004609 (10.63%) (init= 0.5)
    decay:       1.99999983 +/- 0.663348 (33.17%) (init= 0.5)
    c:           0.03789568 +/- 0.004448 (11.74%) (init= 0.03)
    cap:         1 (fixed)
[[Correlations]] (unreported correlations are <  0.100)
    C(decay, c)                  = -0.908
    C(amplitude, c)              = -0.434
    C(amplitude, decay)          =  0.121
Left flank, null model:
[[Model]]
    Model(constant)
[[Fit Statistics]]
    # function evals   = 6
    # data points      = 144
    # variables        = 1
    chi-square         = 0.036
    reduced chi-square = 0.000
    Akaike info crit   = -1193.151
    Bayesian info crit = -1190.181
[[Variables]]
    c:   0.04453994 +/- 0.001318 (2.96%) (init= 0.03)
Right flank, null model:
[[Model]]
    Model(constant)
[[Fit Statistics]]
    # function evals   = 6
    # data points      = 145
    # variables        = 1
    chi-square         = 0.043
    reduced chi-square = 0.000
    Akaike info crit   = -1175.151
    Bayesian info crit = -1172.175
[[Variables]]
    c:   0.05129446 +/- 0.001438 (2.80%) (init= 0.03)