H12 / Uganda An. gambiae / Chromosome 2 / #4
This page describes a signal of selection found in the
Uganda An. gambiae population using the
H12 (Garud et al. 20XX) statistic.The focus of this signal is on chromosome arm
2L between positions 42,760,001 and
42,800,000.
The evidence supporting this signal is
weak ( < 50 on one or both flanks).
Signal location. Blue markers show the values of the selection statistic. The dashed black line shows the fitted peak model. The shaded red area shows the focus of the selection signal. The shaded blue area shows the genomic region in linkage with the selection event. Use the mouse wheel or the controls at the top right of the plot to zoom in, and hover over genes to see gene names and descriptions.
Genes
The following 3 genes overlap the focal region: AGAP007103 (calsyntenin-1), AGAP007104 (farnesyl diphosphate synthase), AGAP007105.
The following 3 genes are within 50 kbp of the focal region: AGAP007106 (ubiquitin carboxyl-terminal hydrolase 47), AGAP007107 (DnaJ homolog subfamily B member 4), AGAP007108 (multiple PDZ domain protein).
Key to insecticide resistance candidate gene types: 1 metabolic; 2 target-site; 3 behavioural; 4 cuticular.
Diagnostics
The information below provides some diagnostics from the Peak modelling algorithm.
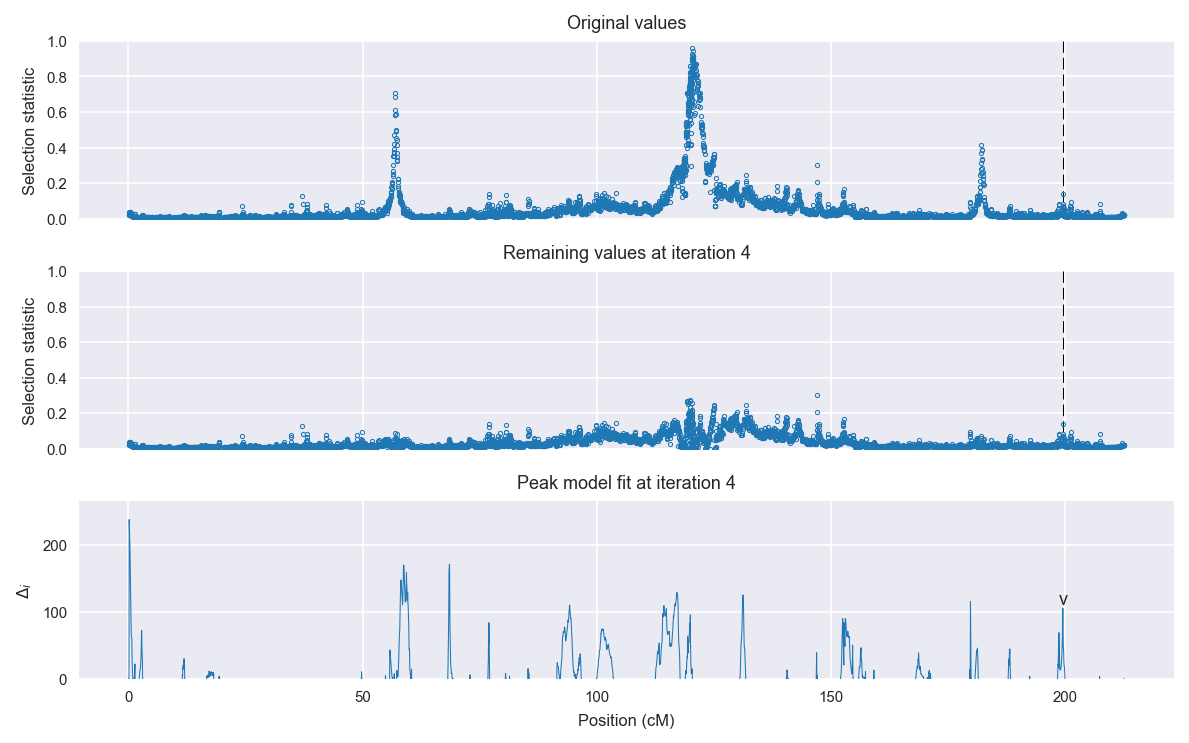
Selection signal in context. @@TODO
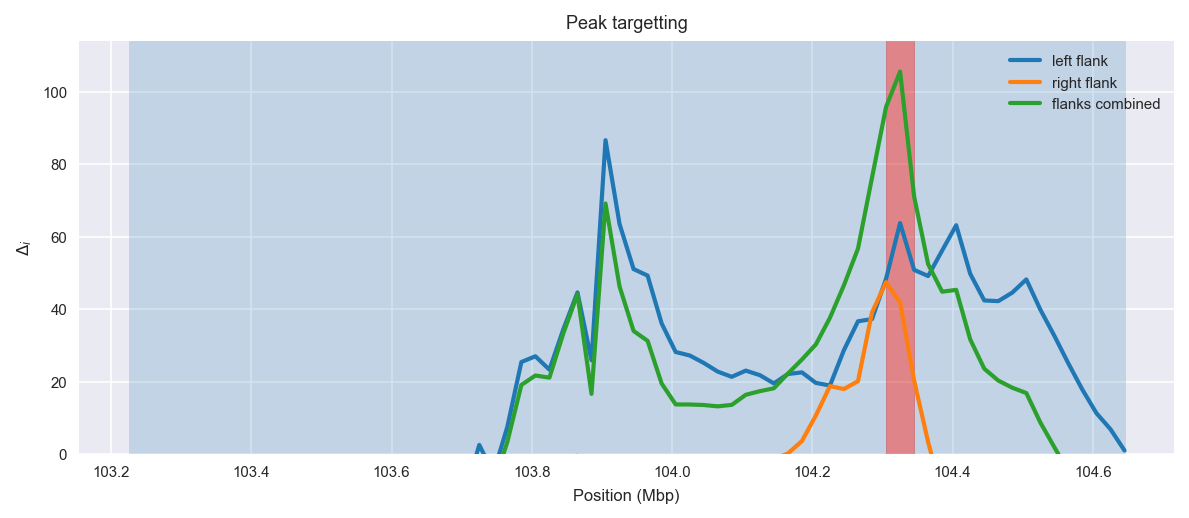
Peak targetting. @@TODO
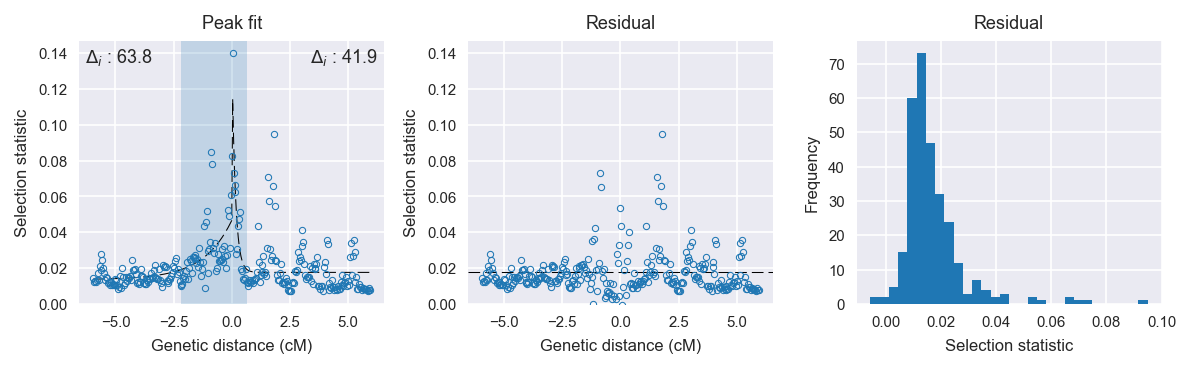
Peak fitting diagnostics. @@TODO
Model fit reports
Left flank, peak model:
[[Model]]
    Model(exponential)
[[Fit Statistics]]
    # function evals   = 31
    # data points      = 150
    # variables        = 3
    chi-square         = 0.013
    reduced chi-square = 0.000
    Akaike info crit   = -1396.326
    Bayesian info crit = -1387.294
[[Variables]]
    amplitude:   0.03307398 +/- 0.003315 (10.02%) (init= 0.5)
    decay:       1.22444150 +/- 0.271965 (22.21%) (init= 0.5)
    c:           0.01356931 +/- 0.001537 (11.33%) (init= 0.03)
    cap:         1 (fixed)
[[Correlations]] (unreported correlations are <  0.100)
    C(decay, c)                  = -0.762
    C(amplitude, decay)          = -0.381
Right flank, peak model:
[[Model]]
    Model(exponential)
[[Fit Statistics]]
    # function evals   = 35
    # data points      = 149
    # variables        = 3
    chi-square         = 0.026
    reduced chi-square = 0.000
    Akaike info crit   = -1285.693
    Bayesian info crit = -1276.681
[[Variables]]
    amplitude:   0.12648656 +/- 0.018297 (14.47%) (init= 0.5)
    decay:       0.15000004 +/- 0.027412 (18.28%) (init= 0.5)
    c:           0.01761329 +/- 0.001144 (6.50%) (init= 0.03)
    cap:         1 (fixed)
[[Correlations]] (unreported correlations are <  0.100)
    C(amplitude, decay)          = -0.782
    C(decay, c)                  = -0.231
Left flank, null model:
[[Model]]
    Model(constant)
[[Fit Statistics]]
    # function evals   = 6
    # data points      = 149
    # variables        = 1
    chi-square         = 0.019
    reduced chi-square = 0.000
    Akaike info crit   = -1332.572
    Bayesian info crit = -1329.568
[[Variables]]
    c:   0.01994507 +/- 0.000933 (4.68%) (init= 0.03)
Right flank, null model:
[[Model]]
    Model(constant)
[[Fit Statistics]]
    # function evals   = 6
    # data points      = 148
    # variables        = 1
    chi-square         = 0.033
    reduced chi-square = 0.000
    Akaike info crit   = -1243.841
    Bayesian info crit = -1240.843
[[Variables]]
    c:   0.01958115 +/- 0.001225 (6.26%) (init= 0.03)