H12 / Uganda An. gambiae / Chromosome 3 / #2
This page describes a signal of selection found in the
Uganda An. gambiae population using the
H12 (Garud et al. 20XX) statistic.The focus of this signal is on chromosome arm
3R between positions 49,600,001 and
49,820,000.
The evidence supporting this signal is
moderate ( >= 50 on both flanks).
Signal location. Blue markers show the values of the selection statistic. The dashed black line shows the fitted peak model. The shaded red area shows the focus of the selection signal. The shaded blue area shows the genomic region in linkage with the selection event. Use the mouse wheel or the controls at the top right of the plot to zoom in, and hover over genes to see gene names and descriptions.
Genes
The following 10 genes overlap the focal region: AGAP010158, AGAP010159 (dUTP pyrophosphatase), AGAP010160 (myosin I), AGAP010161, AGAP010162, AGAP010163 (RpL38 - 60S ribosomal protein L38), AGAP010164 (whd - protein withered, carnitine O-palmitoyltransferase), AGAP010165 (dynein light intermediate chain 2, cytosolic), AGAP010166, AGAP010167 (numb).
The following 5 genes are within 50 kbp of the focal region: AGAP010156 (ATP citrate lyase), AGAP013762, AGAP010157 (Ast2 - allatostatin 2), AGAP010168, AGAP0101692.
Key to insecticide resistance candidate gene types: 1 metabolic; 2 target-site; 3 behavioural; 4 cuticular.
Diagnostics
The information below provides some diagnostics from the Peak modelling algorithm.
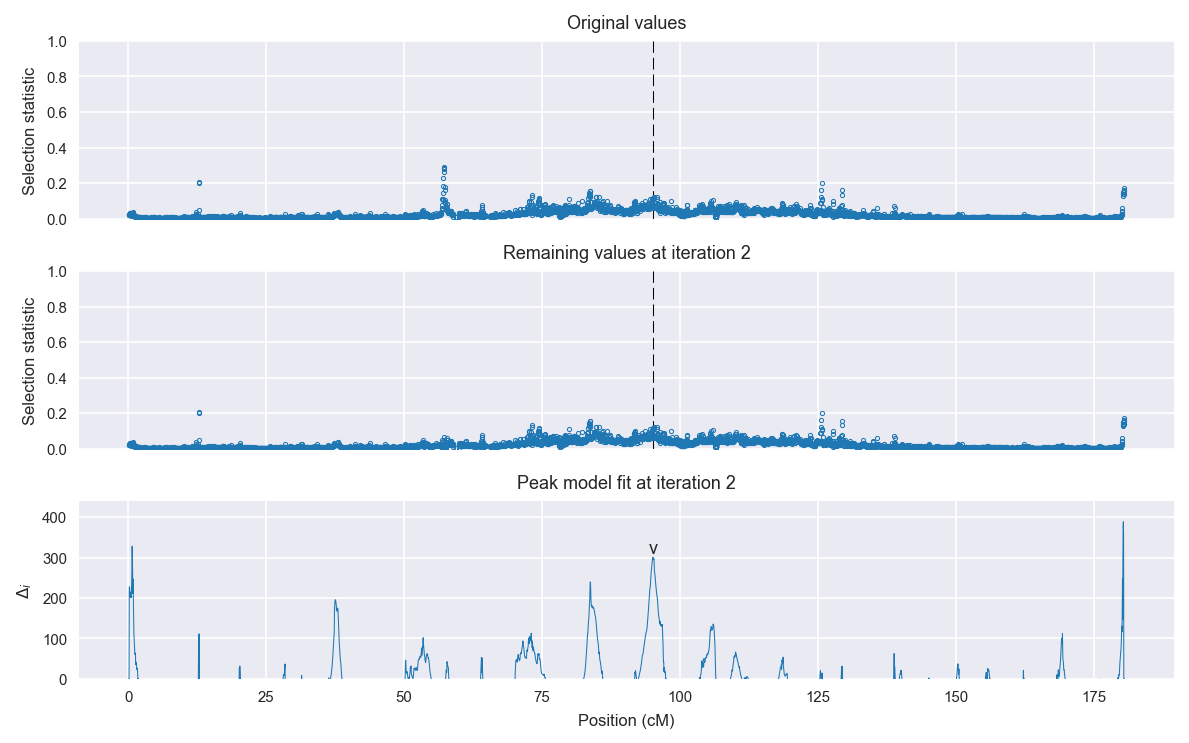
Selection signal in context. @@TODO
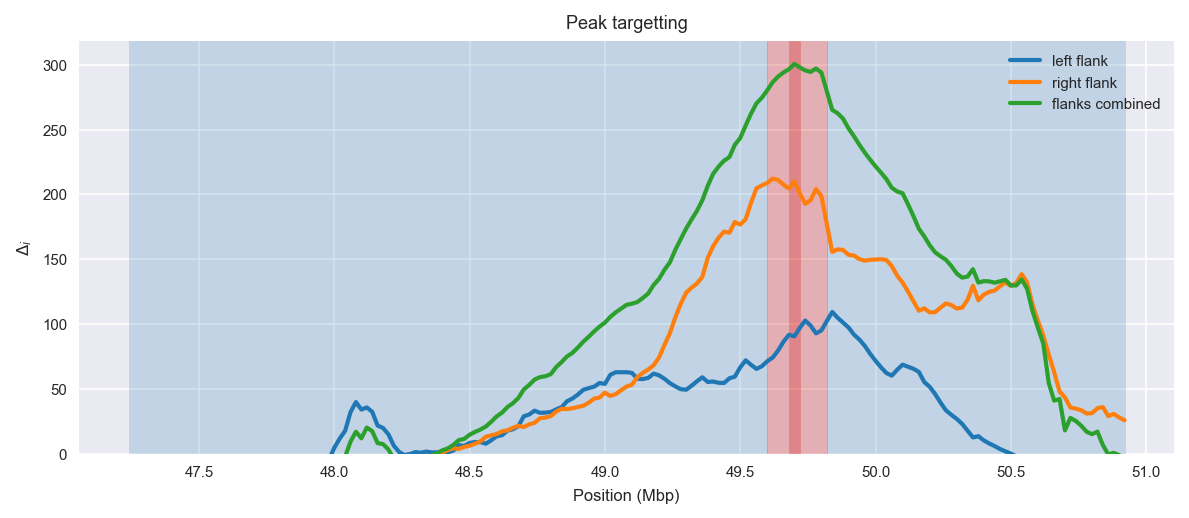
Peak targetting. @@TODO
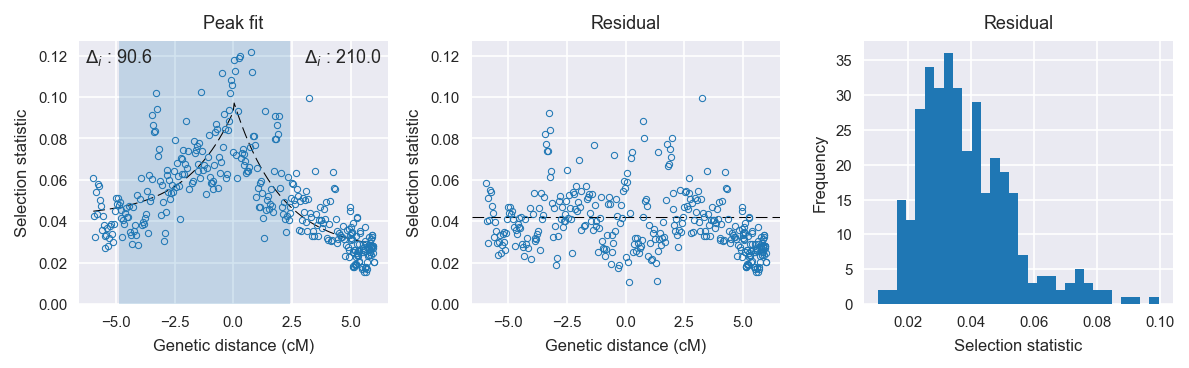
Peak fitting diagnostics. @@TODO
Model fit reports
Left flank, peak model:
[[Model]]
    Model(exponential)
[[Fit Statistics]]
    # function evals   = 56
    # data points      = 145
    # variables        = 3
    chi-square         = 0.028
    reduced chi-square = 0.000
    Akaike info crit   = -1233.493
    Bayesian info crit = -1224.563
[[Variables]]
    amplitude:   0.05062563 +/- 0.004524 (8.94%) (init= 0.5)
    decay:       2          +/- 5.17e-06 (0.00%) (init= 0.5)
    c:           0.04225618 +/- 0.004353 (10.30%) (init= 0.03)
    cap:         1 (fixed)
[[Correlations]] (unreported correlations are <  0.100)
    C(decay, c)                  =  0.906
    C(amplitude, c)              = -0.475
    C(amplitude, decay)          = -0.167
Right flank, peak model:
[[Model]]
    Model(exponential)
[[Fit Statistics]]
    # function evals   = 51
    # data points      = 207
    # variables        = 3
    chi-square         = 0.035
    reduced chi-square = 0.000
    Akaike info crit   = -1791.838
    Bayesian info crit = -1781.840
[[Variables]]
    amplitude:   0.07322357 +/- 0.003790 (5.18%) (init= 0.5)
    decay:       1.99999998 +/- 0.310843 (15.54%) (init= 0.5)
    c:           0.02537728 +/- 0.002924 (11.53%) (init= 0.03)
    cap:         1 (fixed)
[[Correlations]] (unreported correlations are <  0.100)
    C(decay, c)                  = -0.897
    C(amplitude, c)              = -0.173
    C(amplitude, decay)          = -0.153
Left flank, null model:
[[Model]]
    Model(constant)
[[Fit Statistics]]
    # function evals   = 6
    # data points      = 144
    # variables        = 1
    chi-square         = 0.051
    reduced chi-square = 0.000
    Akaike info crit   = -1142.902
    Bayesian info crit = -1139.933
[[Variables]]
    c:   0.05807536 +/- 0.001569 (2.70%) (init= 0.03)
Right flank, null model:
[[Model]]
    Model(constant)
[[Fit Statistics]]
    # function evals   = 6
    # data points      = 206
    # variables        = 1
    chi-square         = 0.094
    reduced chi-square = 0.000
    Akaike info crit   = -1581.789
    Bayesian info crit = -1578.461
[[Variables]]
    c:   0.04296521 +/- 0.001494 (3.48%) (init= 0.03)