H12 / Uganda An. gambiae / Chromosome 3 / #6
This page describes a signal of selection found in the
Uganda An. gambiae population using the
H12 (Garud et al. 20XX) statistic.The focus of this signal is on chromosome arm
3R between positions 36,320,001 and
36,560,000.
The evidence supporting this signal is
weak ( < 50 on one or both flanks).
Signal location. Blue markers show the values of the selection statistic. The dashed black line shows the fitted peak model. The shaded red area shows the focus of the selection signal. The shaded blue area shows the genomic region in linkage with the selection event. Use the mouse wheel or the controls at the top right of the plot to zoom in, and hover over genes to see gene names and descriptions.
Genes
The following 16 genes overlap the focal region: AGAP009566 (zinc finger protein 271), AGAP009567 (mitochondrial inner membrane protease ATP23 homolog), AGAP009568 (dynein heavy chain), AGAP009569 (syntenin-1 isoform 1), AGAP009570 (RNA-binding protein with serine-rich domain 1), AGAP009571, AGAP009572 (RpS15a-2 - 40S ribosomal protein S15a), AGAP009573, AGAP009574 (WD repeat-containing protein 69), AGAP009575 (nuclear receptor subfamily 2 group A), AGAP009576 (collagen alpha 1), AGAP009577, AGAP009578 (adenosine monophosphate-protein transferase FICD homolog), AGAP009579 (dihydropyridine-sensitive l-type calcium channel), AGAP009580, AGAP009581 (collagen type I/II/III/V/XI/XXIV/XXVII alpha).
Gene AGAP009582 is within 50 kbp of the focal region.
Key to insecticide resistance candidate gene types: 1 metabolic; 2 target-site; 3 behavioural; 4 cuticular.
Diagnostics
The information below provides some diagnostics from the Peak modelling algorithm.
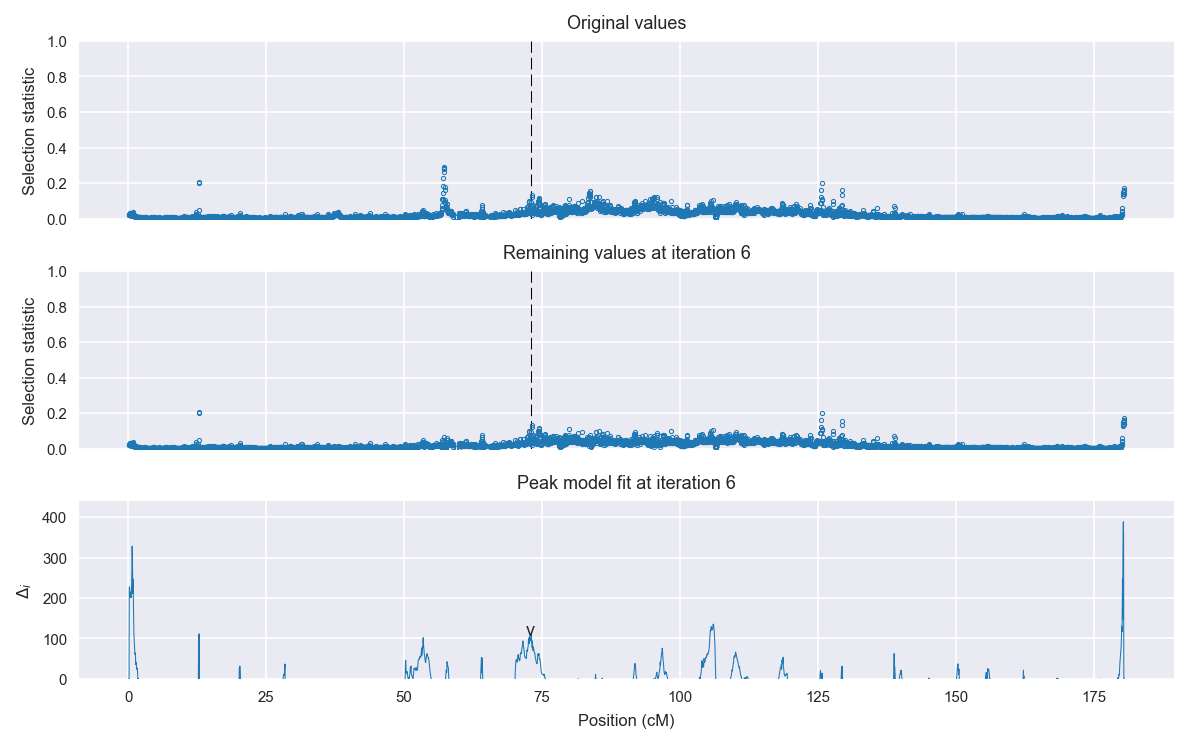
Selection signal in context. @@TODO
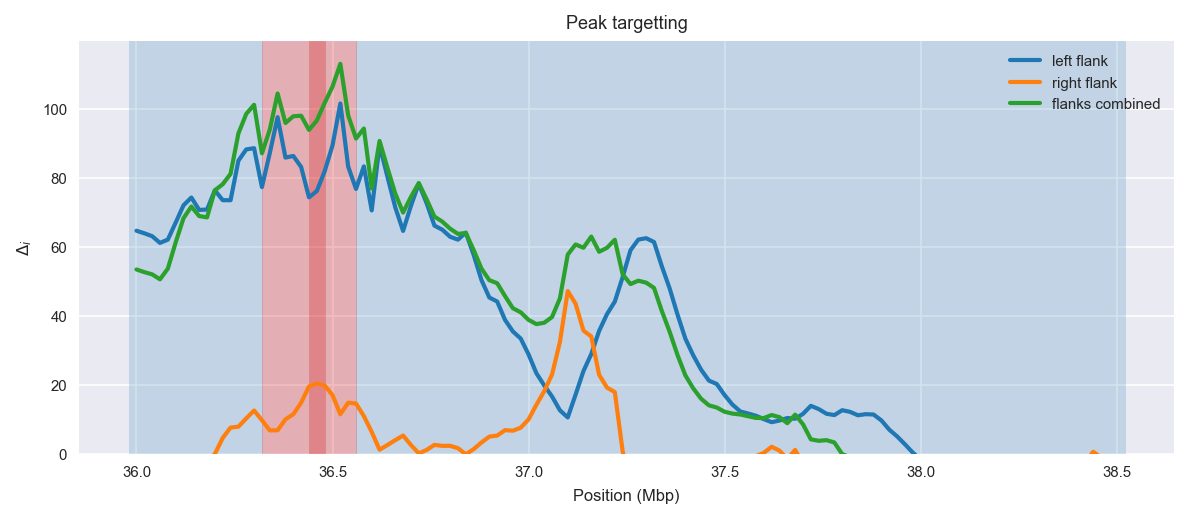
Peak targetting. @@TODO
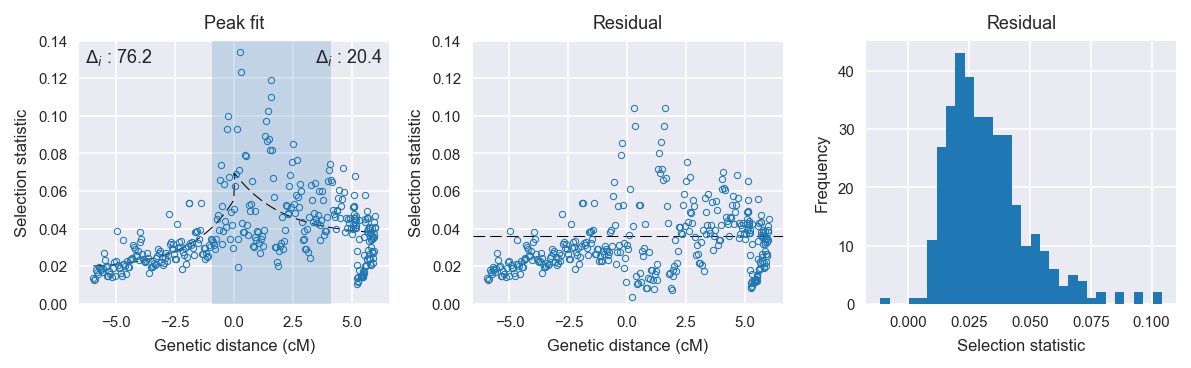
Peak fitting diagnostics. @@TODO
Model fit reports
Left flank, peak model:
[[Model]]
    Model(exponential)
[[Fit Statistics]]
    # function evals   = 39
    # data points      = 148
    # variables        = 3
    chi-square         = 0.014
    reduced chi-square = 0.000
    Akaike info crit   = -1368.153
    Bayesian info crit = -1359.162
[[Variables]]
    amplitude:   0.03645190 +/- 0.003069 (8.42%) (init= 0.5)
    decay:       1.81939135 +/- 0.447513 (24.60%) (init= 0.5)
    c:           0.01872793 +/- 0.002604 (13.91%) (init= 0.03)
    cap:         1 (fixed)
[[Correlations]] (unreported correlations are <  0.100)
    C(decay, c)                  = -0.885
    C(amplitude, c)              = -0.362
Right flank, peak model:
[[Model]]
    Model(exponential)
[[Fit Statistics]]
    # function evals   = 39
    # data points      = 206
    # variables        = 3
    chi-square         = 0.077
    reduced chi-square = 0.000
    Akaike info crit   = -1620.784
    Bayesian info crit = -1610.800
[[Variables]]
    amplitude:   0.03381160 +/- 0.005624 (16.63%) (init= 0.5)
    decay:       1.99999931 +/- 0.991137 (49.56%) (init= 0.5)
    c:           0.03627771 +/- 0.004282 (11.81%) (init= 0.03)
    cap:         1 (fixed)
[[Correlations]] (unreported correlations are <  0.100)
    C(decay, c)                  = -0.894
    C(amplitude, c)              = -0.168
    C(amplitude, decay)          = -0.163
Left flank, null model:
[[Model]]
    Model(constant)
[[Fit Statistics]]
    # function evals   = 6
    # data points      = 147
    # variables        = 1
    chi-square         = 0.022
    reduced chi-square = 0.000
    Akaike info crit   = -1291.971
    Bayesian info crit = -1288.981
[[Variables]]
    c:   0.02910729 +/- 0.001014 (3.49%) (init= 0.03)
Right flank, null model:
[[Model]]
    Model(constant)
[[Fit Statistics]]
    # function evals   = 6
    # data points      = 205
    # variables        = 1
    chi-square         = 0.083
    reduced chi-square = 0.000
    Akaike info crit   = -1600.360
    Bayesian info crit = -1597.037
[[Variables]]
    c:   0.04414337 +/- 0.001405 (3.18%) (init= 0.03)