H12 / Burkina Faso An. coluzzii / Chromosome X / #1
This page describes a signal of selection found in the
Burkina Faso An. coluzzii population using the
H12 (Garud et al. 20XX) statistic.The focus of this signal is on chromosome arm
X between positions 15,100,001 and
15,380,000.
The evidence supporting this signal is
strong ( >= 100 on both flanks).
Signal location. Blue markers show the values of the selection statistic. The dashed black line shows the fitted peak model. The shaded red area shows the focus of the selection signal. The shaded blue area shows the genomic region in linkage with the selection event. Use the mouse wheel or the controls at the top right of the plot to zoom in, and hover over genes to see gene names and descriptions.
Genes
The following 14 genes overlap the focal region: AGAP012997, AGAP0008181 (CYP9K1 - cytochrome P450), AGAP000819 (nuclear receptor subfamily 2 group E member (Tailless)), AGAP0008204 (CPR125 - cuticular protein RR-2 family 125), AGAP000821, AGAP000822, AGAP000823 (CD81 antigen), AGAP000824 (bone morphogenetic protein 5), AGAP000825, AGAP000826 (cap-specific mRNA (nucleoside-2’-O-)-methyltransferase 1), AGAP000829 (calpain-15), AGAP000830 (CASPS7 - short caspase 7), AGAP000831 (DnaJ homolog subfamily C member 25), AGAP000832 (Derlin-2/3).
The following 4 genes are within 50 kbp of the focal region: AGAP013173, AGAP013424, AGAP000833 (MIP - myoinhibitory-like peptide), AGAP000834.
Key to insecticide resistance candidate gene types: 1 metabolic; 2 target-site; 3 behavioural; 4 cuticular.
Overlapping signals
The following selection signals have a focus which overlaps with the focus of this signal.
| Signal | Focus | Score (Left | Right) |
|---|---|---|
| H12 / Burkina Faso An. gambiae / Chromosome X / #1 | X:15,120,001-15,260,000 | 836 (494 | 342) |
| H12 / Uganda An. gambiae / Chromosome X / #1 | X:15,320,001-15,460,000 | 384 (293 | 90) |
Diagnostics
The information below provides some diagnostics from the Peak modelling algorithm.
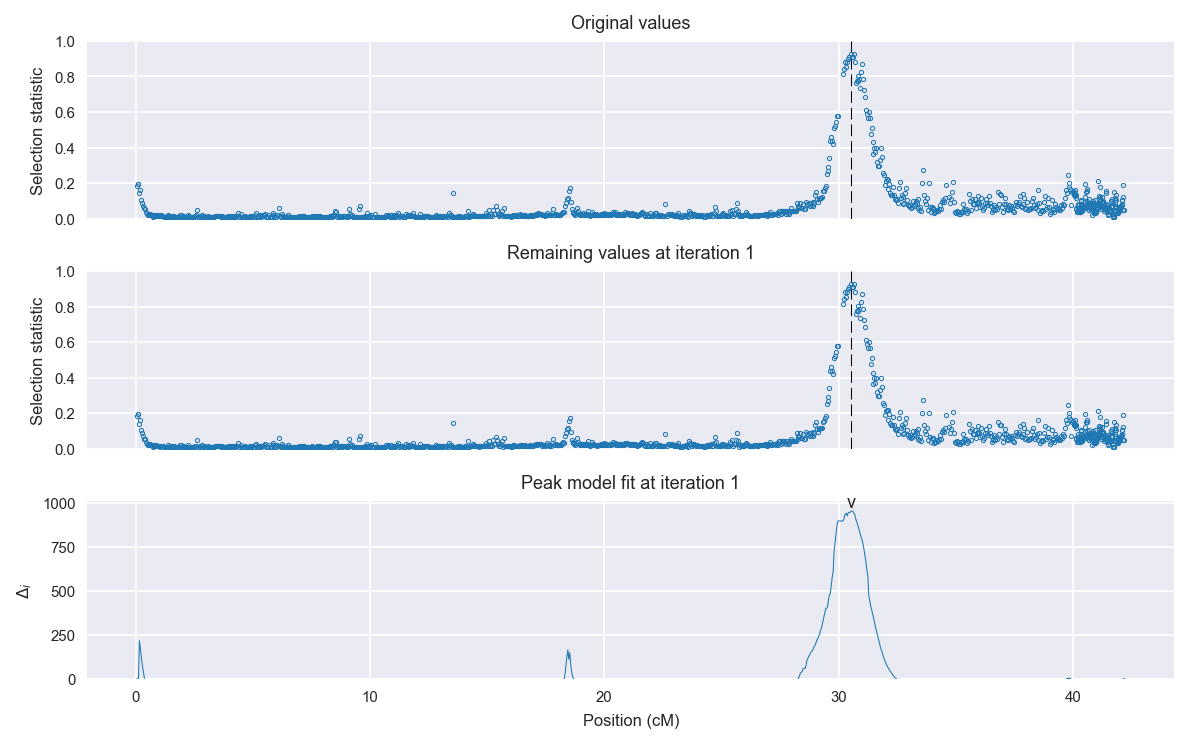
Selection signal in context. @@TODO
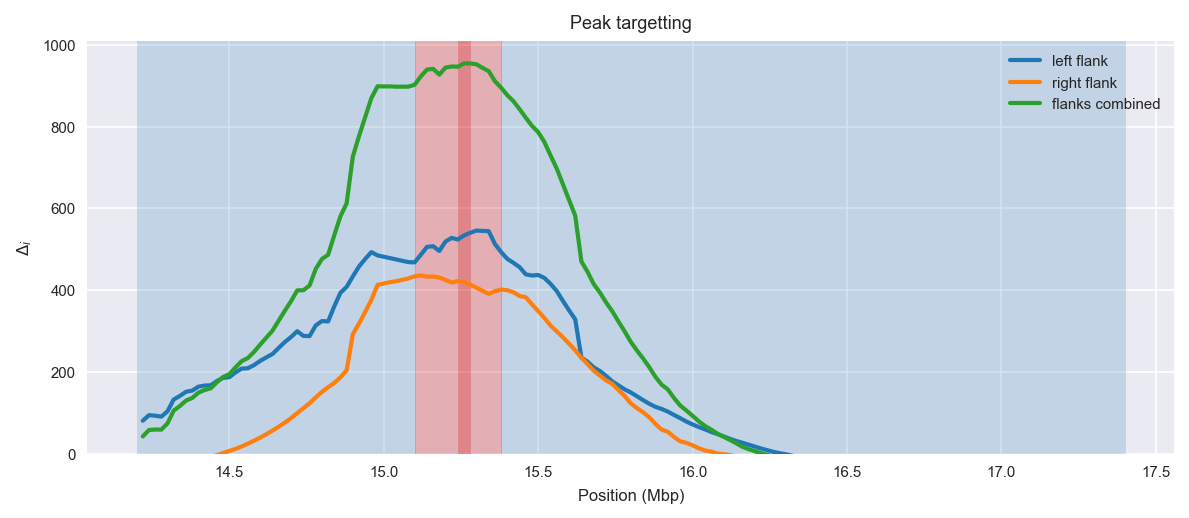
Peak targetting. @@TODO
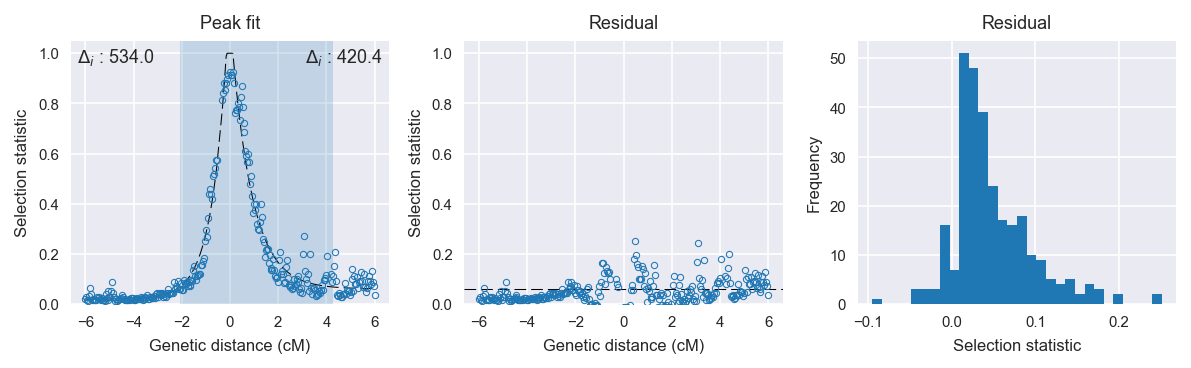
Peak fitting diagnostics. @@TODO
Model fit reports
Left flank, peak model:
[[Model]]
    Model(exponential)
[[Fit Statistics]]
    # function evals   = 39
    # data points      = 145
    # variables        = 3
    chi-square         = 0.157
    reduced chi-square = 0.001
    Akaike info crit   = -984.357
    Bayesian info crit = -975.426
[[Variables]]
    amplitude:   1.24358433 +/- 0.027627 (2.22%) (init= 0.5)
    decay:       0.64126418 +/- 0.017812 (2.78%) (init= 0.5)
    c:           0.01890907 +/- 0.003651 (19.31%) (init= 0.03)
    cap:         1 (fixed)
[[Correlations]] (unreported correlations are <  0.100)
    C(amplitude, decay)          = -0.734
    C(decay, c)                  = -0.526
    C(amplitude, c)              =  0.131
Right flank, peak model:
[[Model]]
    Model(exponential)
[[Fit Statistics]]
    # function evals   = 49
    # data points      = 147
    # variables        = 3
    chi-square         = 0.449
    reduced chi-square = 0.003
    Akaike info crit   = -845.398
    Bayesian info crit = -836.427
[[Variables]]
    amplitude:   1.07999838 +/- 0.030585 (2.83%) (init= 0.5)
    decay:       0.85946753 +/- 0.039369 (4.58%) (init= 0.5)
    c:           0.05999991 +/- 0.007127 (11.88%) (init= 0.03)
    cap:         1 (fixed)
[[Correlations]] (unreported correlations are <  0.100)
    C(amplitude, decay)          = -0.667
    C(decay, c)                  = -0.632
    C(amplitude, c)              =  0.108
Left flank, null model:
[[Model]]
    Model(constant)
[[Fit Statistics]]
    # function evals   = 6
    # data points      = 144
    # variables        = 1
    chi-square         = 6.225
    reduced chi-square = 0.044
    Akaike info crit   = -450.342
    Bayesian info crit = -447.372
[[Variables]]
    c:   0.12064537 +/- 0.017386 (14.41%) (init= 0.03)
Right flank, null model:
[[Model]]
    Model(constant)
[[Fit Statistics]]
    # function evals   = 6
    # data points      = 146
    # variables        = 1
    chi-square         = 7.837
    reduced chi-square = 0.054
    Akaike info crit   = -425.004
    Bayesian info crit = -422.021
[[Variables]]
    c:   0.20854010 +/- 0.019241 (9.23%) (init= 0.03)