H12 / Burkina Faso An. gambiae / Chromosome 3 / #3
This page describes a signal of selection found in the
Burkina Faso An. gambiae population using the
H12 (Garud et al. 20XX) statistic.The focus of this signal is on chromosome arm
3R between positions 4,580,001 and
4,760,000.
The evidence supporting this signal is
weak ( < 50 on one or both flanks).
Signal location. Blue markers show the values of the selection statistic. The dashed black line shows the fitted peak model. The shaded red area shows the focus of the selection signal. The shaded blue area shows the genomic region in linkage with the selection event. Use the mouse wheel or the controls at the top right of the plot to zoom in, and hover over genes to see gene names and descriptions.
Genes
Gene AGAP028427 overlaps the focal region.
The following 14 genes are within 50 kbp of the focal region: AGAP008028 (voltage-dependent calcium channel beta, invertebrate), AGAP008033, AGAP013760, AGAP008034 (solute carrier family 39 (zinc transporter), member 7), AGAP008035, AGAP008036, AGAP008037 (KDEL (Lys-Asp-Glu-Leu) containing 1, isoform CRA_a), AGAP008039 (protein kinase A), AGAP008040, AGAP008041 (RING finger protein 121), AGAP0080421 (pyridine nucleotide-disulfide oxidoreductase domain 1), AGAP008043 (mRpS18B - 28S ribosomal protein S18B, mitochondrial), AGAP0080441 (programmed cell death 8 (apoptosis-inducing factor)), AGAP008045 (transcription initiation factor TFIID subunit 13).
Key to insecticide resistance candidate gene types: 1 metabolic; 2 target-site; 3 behavioural; 4 cuticular.
Overlapping signals
The following selection signals have a focus which overlaps with the focus of this signal.
| Signal | Focus | Score (Left | Right) |
|---|---|---|
| H12 / Guinea An. gambiae / Chromosome 3 / #2 | 3R:4,580,001-4,740,000 | 235 (152 | 82) |
Diagnostics
The information below provides some diagnostics from the Peak modelling algorithm.
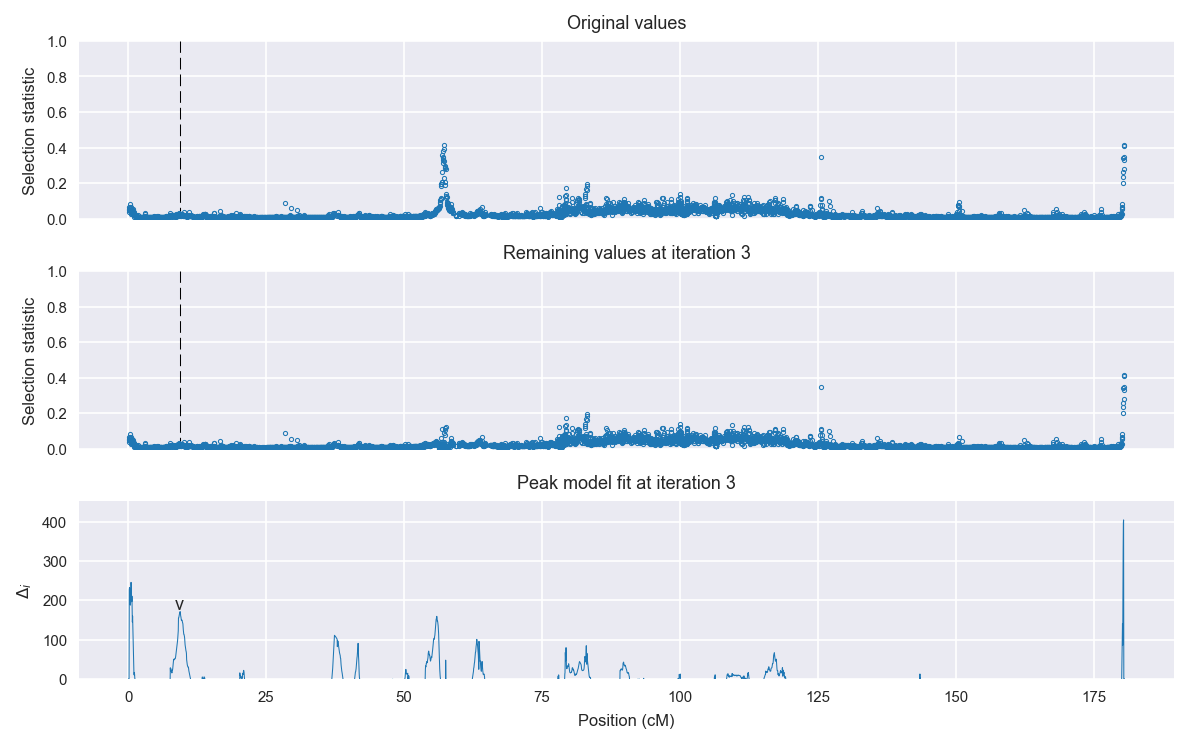
Selection signal in context. @@TODO
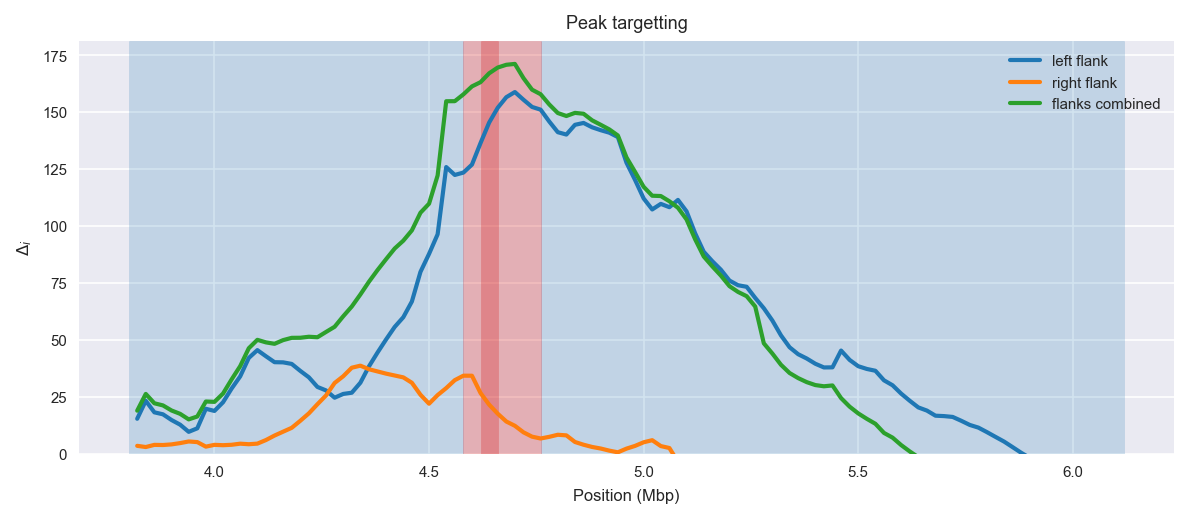
Peak targetting. @@TODO
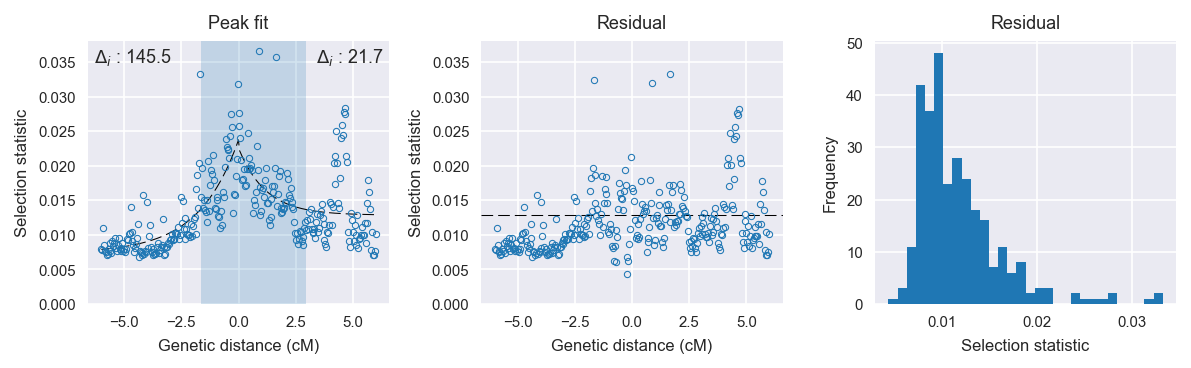
Peak fitting diagnostics. @@TODO
Model fit reports
Left flank, peak model:
[[Model]]
    Model(exponential)
[[Fit Statistics]]
    # function evals   = 31
    # data points      = 151
    # variables        = 3
    chi-square         = 0.002
    reduced chi-square = 0.000
    Akaike info crit   = -1730.904
    Bayesian info crit = -1721.853
[[Variables]]
    amplitude:   0.01636842 +/- 0.001007 (6.15%) (init= 0.5)
    decay:       1.74159251 +/- 0.303912 (17.45%) (init= 0.5)
    c:           0.00736559 +/- 0.000791 (10.74%) (init= 0.03)
    cap:         1 (fixed)
[[Correlations]] (unreported correlations are <  0.100)
    C(decay, c)                  = -0.873
    C(amplitude, c)              = -0.304
Right flank, peak model:
[[Model]]
    Model(exponential)
[[Fit Statistics]]
    # function evals   = 31
    # data points      = 150
    # variables        = 3
    chi-square         = 0.003
    reduced chi-square = 0.000
    Akaike info crit   = -1594.470
    Bayesian info crit = -1585.438
[[Variables]]
    amplitude:   0.00970744 +/- 0.001852 (19.08%) (init= 0.5)
    decay:       1.18732565 +/- 0.476336 (40.12%) (init= 0.5)
    c:           0.01285424 +/- 0.000770 (5.99%) (init= 0.03)
    cap:         1 (fixed)
[[Correlations]] (unreported correlations are <  0.100)
    C(decay, c)                  = -0.750
    C(amplitude, decay)          = -0.458
Left flank, null model:
[[Model]]
    Model(constant)
[[Fit Statistics]]
    # function evals   = 6
    # data points      = 150
    # variables        = 1
    chi-square         = 0.004
    reduced chi-square = 0.000
    Akaike info crit   = -1585.386
    Bayesian info crit = -1582.376
[[Variables]]
    c:   0.01184931 +/- 0.000413 (3.48%) (init= 0.03)
Right flank, null model:
[[Model]]
    Model(constant)
[[Fit Statistics]]
    # function evals   = 6
    # data points      = 149
    # variables        = 1
    chi-square         = 0.004
    reduced chi-square = 0.000
    Akaike info crit   = -1572.816
    Bayesian info crit = -1569.812
[[Variables]]
    c:   0.01458435 +/- 0.000417 (2.86%) (init= 0.03)