H12 / Burkina Faso An. gambiae / Chromosome 3 / #6
This page describes a signal of selection found in the
Burkina Faso An. gambiae population using the
H12 (Garud et al. 20XX) statistic.The focus of this signal is on chromosome arm
3R between positions 18,600,001 and
19,100,000.
The evidence supporting this signal is
weak ( < 50 on one or both flanks).
Signal location. Blue markers show the values of the selection statistic. The dashed black line shows the fitted peak model. The shaded red area shows the focus of the selection signal. The shaded blue area shows the genomic region in linkage with the selection event. Use the mouse wheel or the controls at the top right of the plot to zoom in, and hover over genes to see gene names and descriptions.
Genes
The following 10 genes overlap the focal region: AGAP028559, AGAP008823, AGAP008824, AGAP008825, AGAP008826, AGAP028025, AGAP008827, AGAP028123, AGAP008828 (ATP-binding protein involved in chromosome partitioning), AGAP008829.
The following 4 genes are within 50 kbp of the focal region: AGAP008822 (FK506-binding protein 14), AGAP008830 (non-lysosomal glucosylceramidase), AGAP008831 (Stress-activated map kinase-interacting protein 1), AGAP008832 (cyclic AMP-dependent transcription factor ATF-6 alpha).
Key to insecticide resistance candidate gene types: 1 metabolic; 2 target-site; 3 behavioural; 4 cuticular.
Overlapping signals
The following selection signals have a focus which overlaps with the focus of this signal.
| Signal | Focus | Score (Left | Right) |
|---|---|---|
| H12 / Uganda An. gambiae / Chromosome 3 / #4 | 3R:18,700,001-18,820,000 | 195 (88 | 107) |
| H12 / Guinea An. gambiae / Chromosome 3 / #4 | 3R:18,980,001-19,020,000 | 88 (57 | 30) |
Diagnostics
The information below provides some diagnostics from the Peak modelling algorithm.
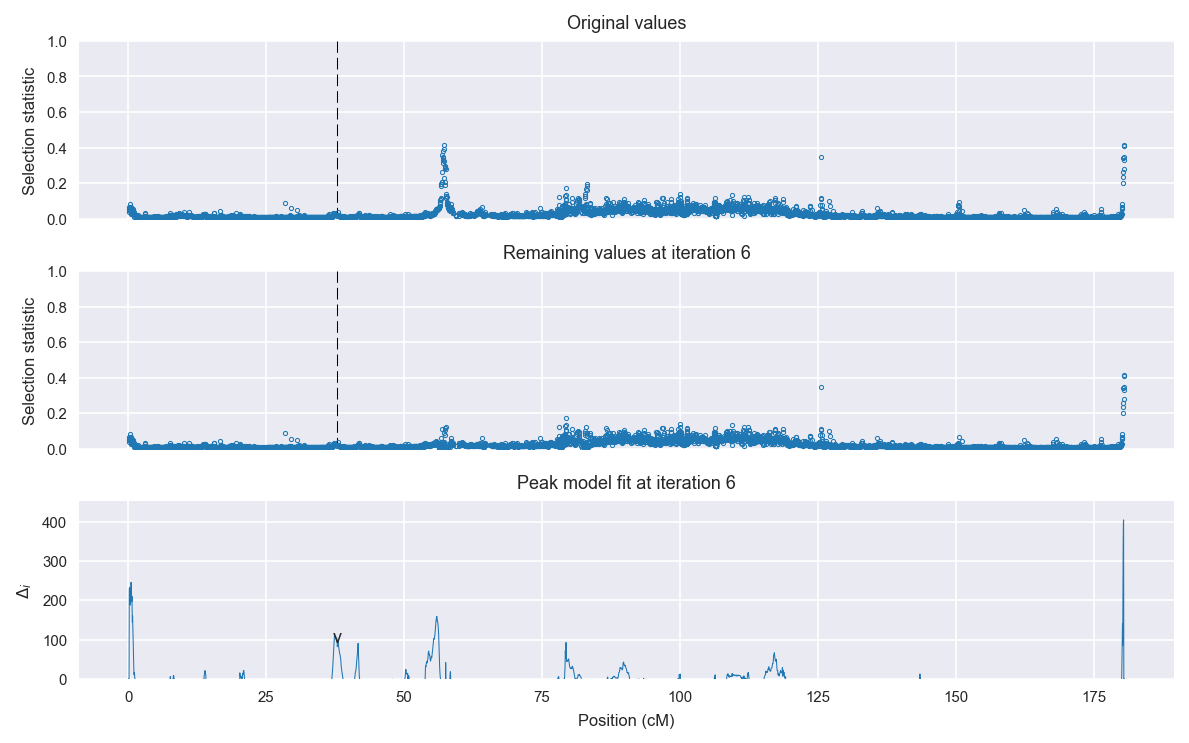
Selection signal in context. @@TODO
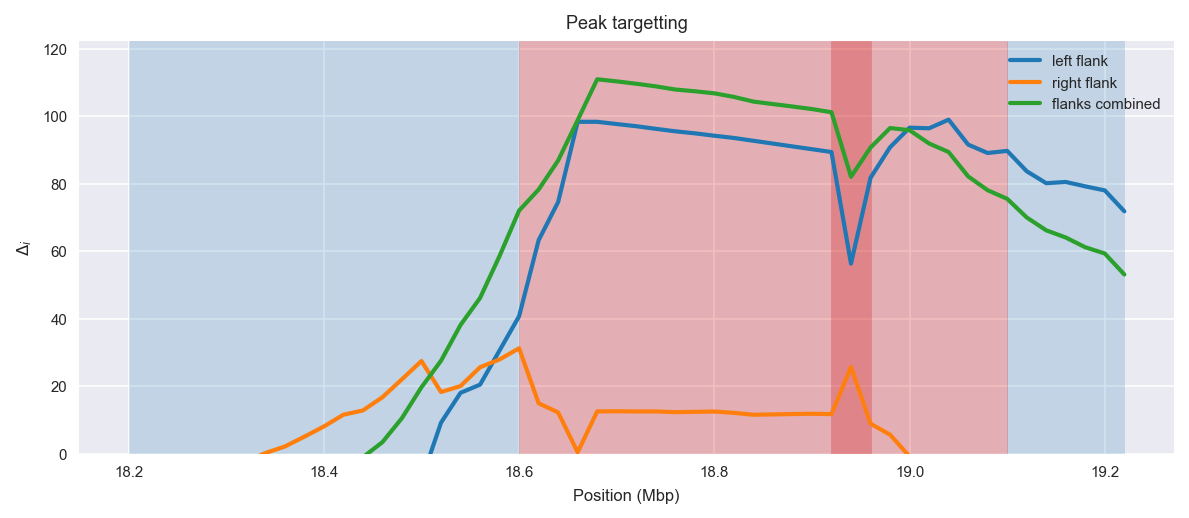
Peak targetting. @@TODO
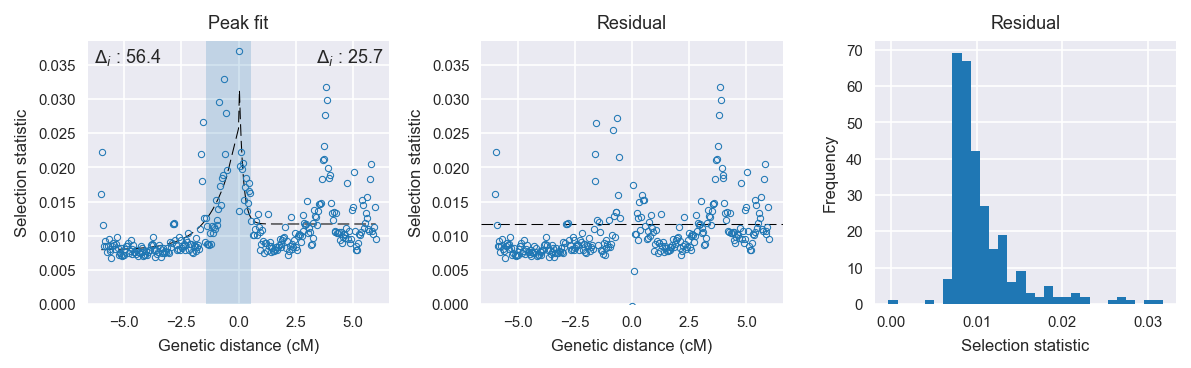
Peak fitting diagnostics. @@TODO
Model fit reports
Left flank, peak model:
[[Model]]
    Model(exponential)
[[Fit Statistics]]
    # function evals   = 55
    # data points      = 139
    # variables        = 3
    chi-square         = 0.002
    reduced chi-square = 0.000
    Akaike info crit   = -1569.507
    Bayesian info crit = -1560.704
[[Variables]]
    amplitude:   0.01779537 +/- 0.002517 (14.15%) (init= 0.5)
    decay:       1.02930732 +/- 0.195671 (19.01%) (init= 0.5)
    c:           0.00789943 +/- 0.000503 (6.37%) (init= 0.03)
    cap:         1 (fixed)
[[Correlations]] (unreported correlations are <  0.100)
    C(amplitude, decay)          = -0.707
    C(decay, c)                  = -0.686
    C(amplitude, c)              =  0.183
Right flank, peak model:
[[Model]]
    Model(exponential)
[[Fit Statistics]]
    # function evals   = 35
    # data points      = 149
    # variables        = 3
    chi-square         = 0.003
    reduced chi-square = 0.000
    Akaike info crit   = -1628.209
    Bayesian info crit = -1619.197
[[Variables]]
    amplitude:   0.02507563 +/- 0.005423 (21.63%) (init= 0.5)
    decay:       0.16372860 +/- 0.045421 (27.74%) (init= 0.5)
    c:           0.01171321 +/- 0.000364 (3.10%) (init= 0.03)
    cap:         1 (fixed)
[[Correlations]] (unreported correlations are <  0.100)
    C(amplitude, decay)          = -0.775
    C(decay, c)                  = -0.234
Left flank, null model:
[[Model]]
    Model(constant)
[[Fit Statistics]]
    # function evals   = 6
    # data points      = 138
    # variables        = 1
    chi-square         = 0.002
    reduced chi-square = 0.000
    Akaike info crit   = -1513.146
    Bayesian info crit = -1510.218
[[Variables]]
    c:   0.00987886 +/- 0.000353 (3.57%) (init= 0.03)
Right flank, null model:
[[Model]]
    Model(constant)
[[Fit Statistics]]
    # function evals   = 6
    # data points      = 148
    # variables        = 1
    chi-square         = 0.003
    reduced chi-square = 0.000
    Akaike info crit   = -1602.465
    Bayesian info crit = -1599.467
[[Variables]]
    c:   0.01215001 +/- 0.000365 (3.00%) (init= 0.03)