H12/AOM/2/7
This page describes a signal of selection found in the
Angola An. coluzzii populationusing the H12 (Garud et al. 20XX) statistic.The focus of this signal is on chromosome arm
2R between positions 34,040,000 and
34,220,000.
The evidence supporting this signal is
moderate ( >= 50 on both flanks).
Signal location. Blue markers show the values of the selection statistic. The dashed black line shows the fitted peak model. The shaded red area shows the focus of the selection signal. The shaded blue area shows the genomic region in linkage with the selection event. Use the mouse wheel or the controls at the top right of the plot to zoom in, and hover over genes to see gene names and descriptions.
Genes
The following 9 genes overlap the focal region: AGAP003226 (dynein heavy chain 2), AGAP003227 (nucleoside-diphosphate kinase), AGAP003228 (histone acetyltransferase type B subunit 2), AGAP003229, AGAP003230 (poly (ADP-ribose) polymerase), AGAP0032311 (NADH dehydrogenase (ubiquinone) iron-sulfur protein 7, mitochondrial), AGAP003232 (splicing factor 4), AGAP0133041, AGAP0032331.
The following 14 genes are within 50 kbp of the focal region: AGAP003212 (Adrenodoxin), AGAP003213 (nijmegen breakage syndrome protein 1), AGAP003214, AGAP003215 (26S proteasome regulatory subunit T2), AGAP003216 (26S proteasome regulatory subunit T2), AGAP003217 (mRpS6 - 28S ribosomal protein S6, mitochondrial), AGAP003218, AGAP003219, AGAP003220, AGAP003221 (ABCC3 - ATP-binding cassette transporter (ABC transporter) family C member 3), AGAP003222 (phosphatidylinositol glycan, class N), AGAP003224, AGAP003225, AGAP003235 (lachesin).
Key to insecticide resistance candidate gene types: 1 metabolic; 2 target-site; 3 behavioural; 4 cuticular.
Overlapping selection signals
The following selection signals have a focus which overlaps with the focus of this signal.
| Signal | Statistic | Population | Focus | Peak model |
Max. percentile | Known locus |
|---|---|---|---|---|---|---|
| IHS/AOM/2/3 | IHS | Angola An. coluzzii | 2R:33,940,000-34,440,000 | 213 | 99.8% | nan |
Diagnostics
The information below provides some diagnostics from the Peak modelling algorithm.
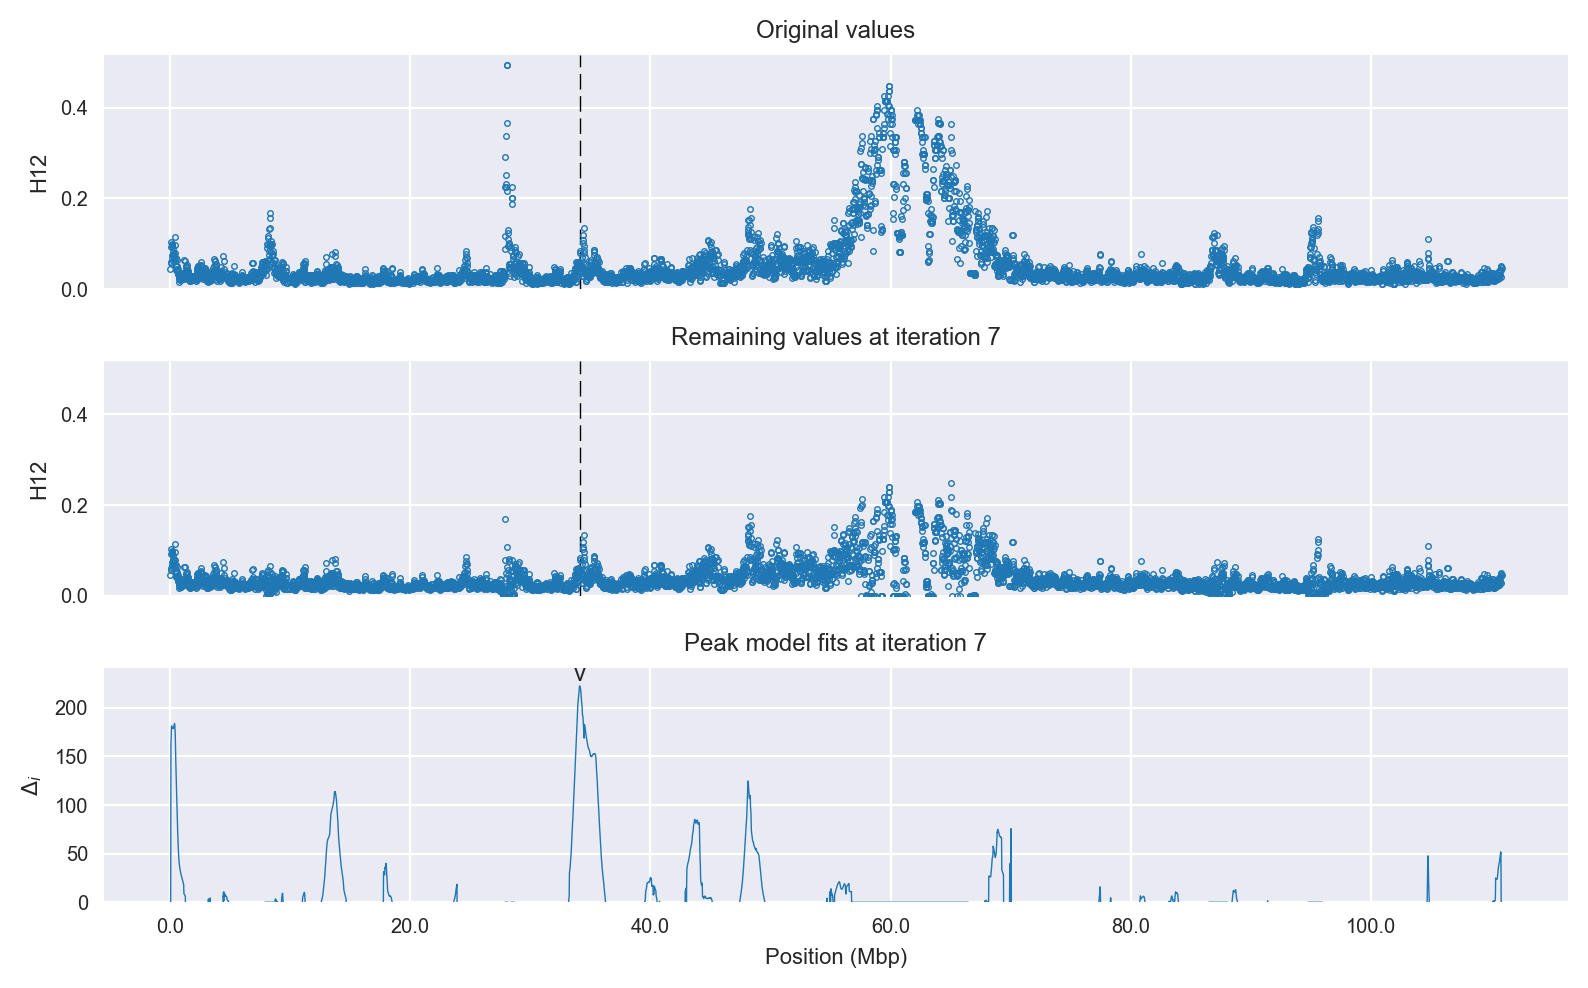
Selection signal in context. @@TODO
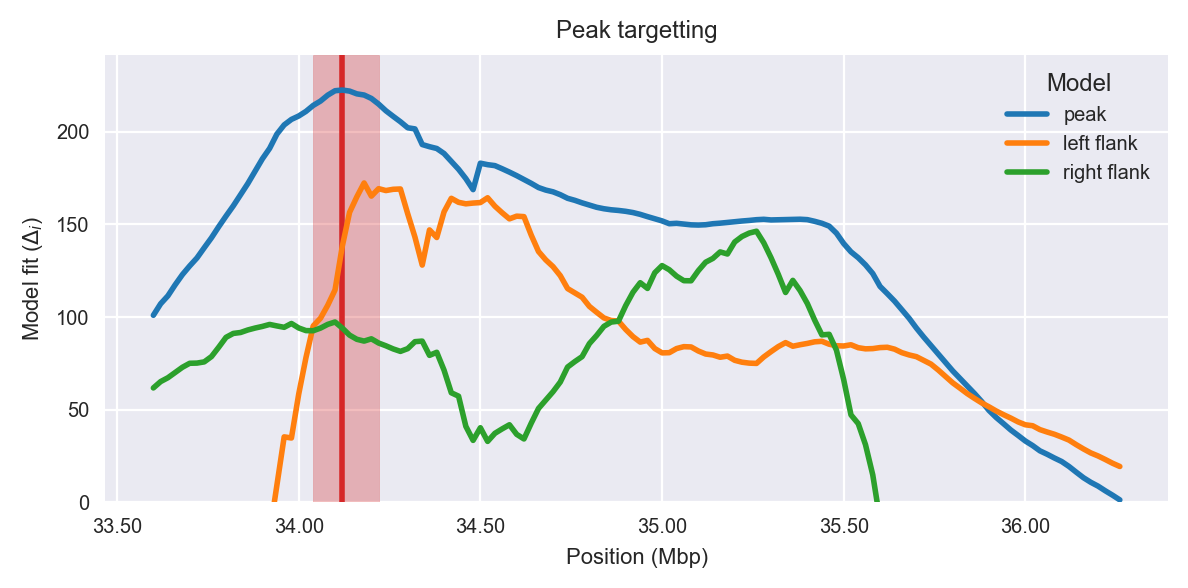
Peak targetting. @@TODO
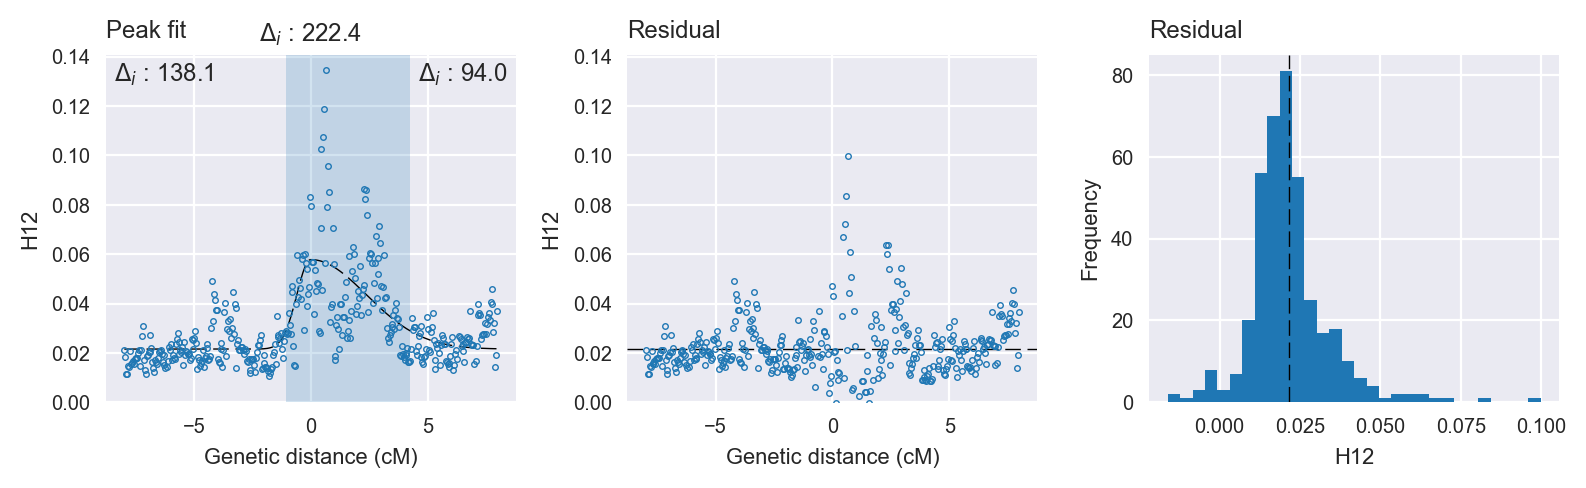
Peak fitting diagnostics. @@TODO
Model fit reports
Peak model:
[[Model]]
    Model(skewed_gaussian)
[[Fit Statistics]]
    # function evals   = 58
    # data points      = 397
    # variables        = 4
    chi-square         = 0.064
    reduced chi-square = 0.000
    Akaike info crit   = -3459.820
    Bayesian info crit = -3443.884
[[Variables]]
    center:      0 (fixed)
    amplitude:   0.03626735 +/- 0.002027 (5.59%) (init= 0.5)
    sigma:       1.19266080 +/- 0.094898 (7.96%) (init= 0.5)
    skew:       -0.99999999 +/- 0.022512 (2.25%) (init= 0)
    baseline:    0.02154307 +/- 0.000897 (4.16%) (init= 0.03)
    ceiling:     1 (fixed)
    floor:       0 (fixed)
[[Correlations]] (unreported correlations are <  0.100)
    C(sigma, skew)               =  0.472
    C(sigma, baseline)           = -0.433
    C(amplitude, baseline)       = -0.319
    C(amplitude, sigma)          = -0.283
Null model:
[[Model]]
    Model(constant)
[[Fit Statistics]]
    # function evals   = 7
    # data points      = 396
    # variables        = 1
    chi-square         = 0.111
    reduced chi-square = 0.000
    Akaike info crit   = -3237.452
    Bayesian info crit = -3233.471
[[Variables]]
    c:   0.02980393 +/- 0.000842 (2.83%) (init= 0.03)