H12/GAS/3/2
This page describes a signal of selection found in the
Gabon An. gambiae populationusing the H12 (Garud et al. 20XX) statistic.The focus of this signal is on chromosome arm
3R between positions 41,680,000 and
41,980,000.
The evidence supporting this signal is
weak ( < 50 on one or both flanks).
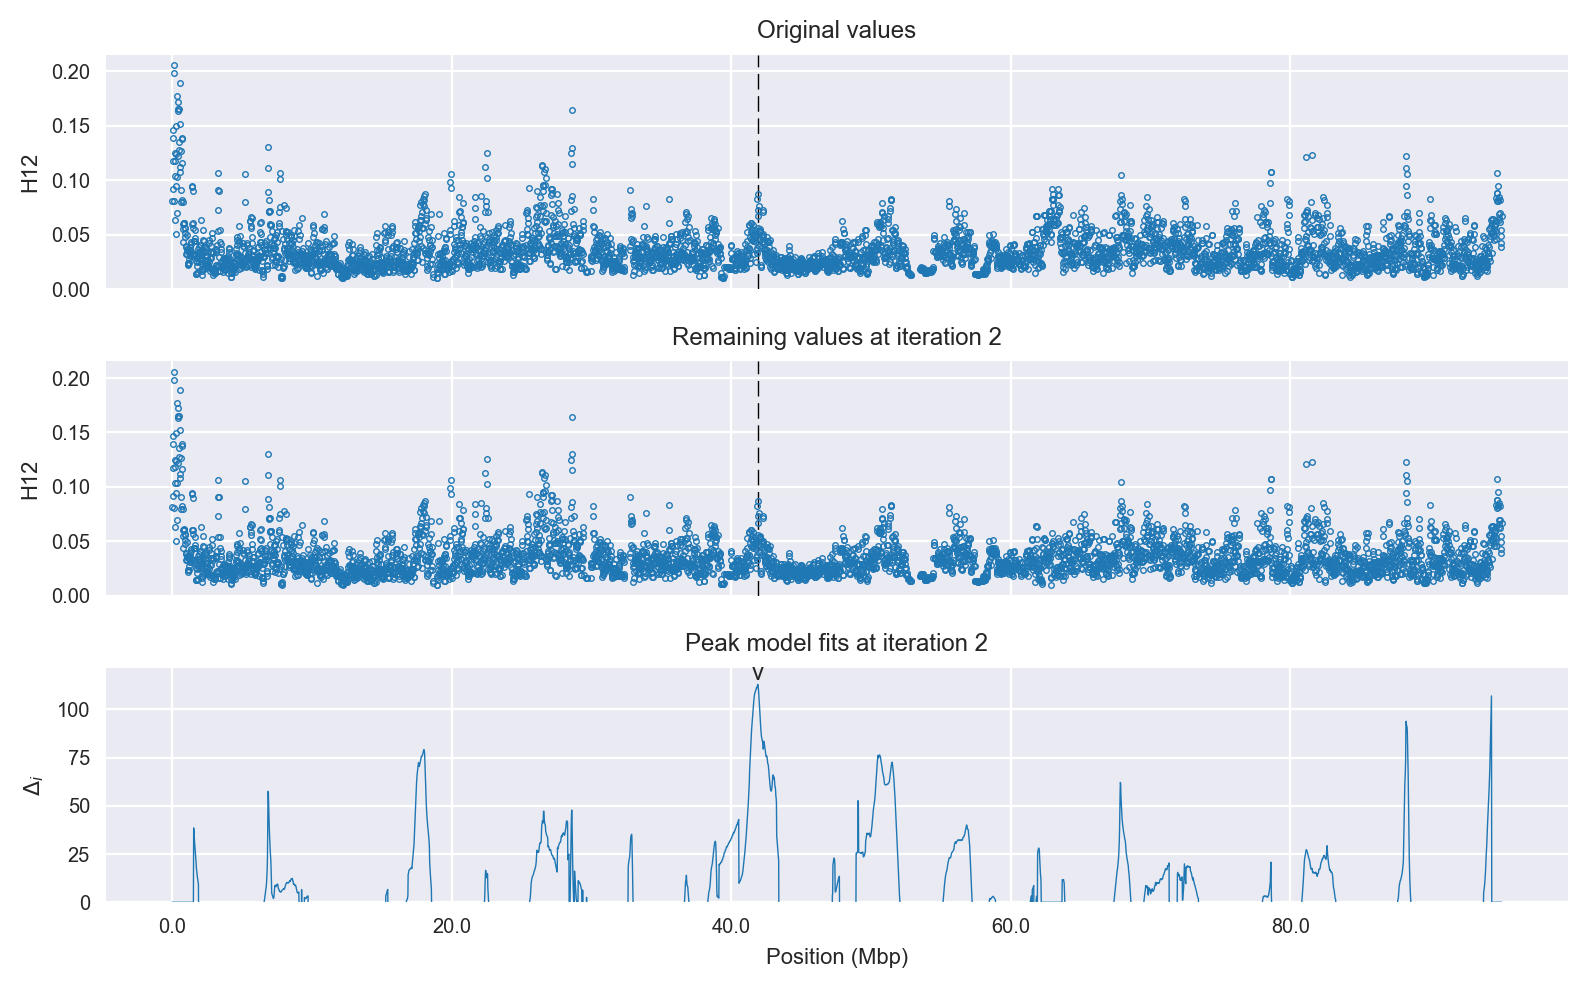
Signal location. Blue markers show the values of the selection statistic. The dashed black line shows the fitted peak model. The shaded red area shows the focus of the selection signal. The shaded blue area shows the genomic region in linkage with the selection event. Use the mouse wheel or the controls at the top right of the plot to zoom in, and hover over genes to see gene names and descriptions.
Genes
The following 9 genes overlap the focal region: AGAP009726, AGAP009727 (RhoGAP92B), AGAP009728 (ficolin), AGAP009729 (CCAP - cardioacceleratory peptide), AGAP009730 (myosin III), AGAP009731 (wingless-type MMTV integration site family, member 10A), AGAP009732 (Protein Wnt), AGAP009733 (wingless-type MMTV integration site family, member 6), AGAP009734 (wingless-type MMTV integration site family, member 1).
The following 2 genes are within 50 kbp of the focal region: AGAP009725 (cadherin), AGAP009735 (wingless-type MMTV integration site family, member 16).
Key to insecticide resistance candidate gene types: 1 metabolic; 2 target-site; 3 behavioural; 4 cuticular.
Diagnostics
The information below provides some diagnostics from the Peak modelling algorithm.
Selection signal in context. @@TODO
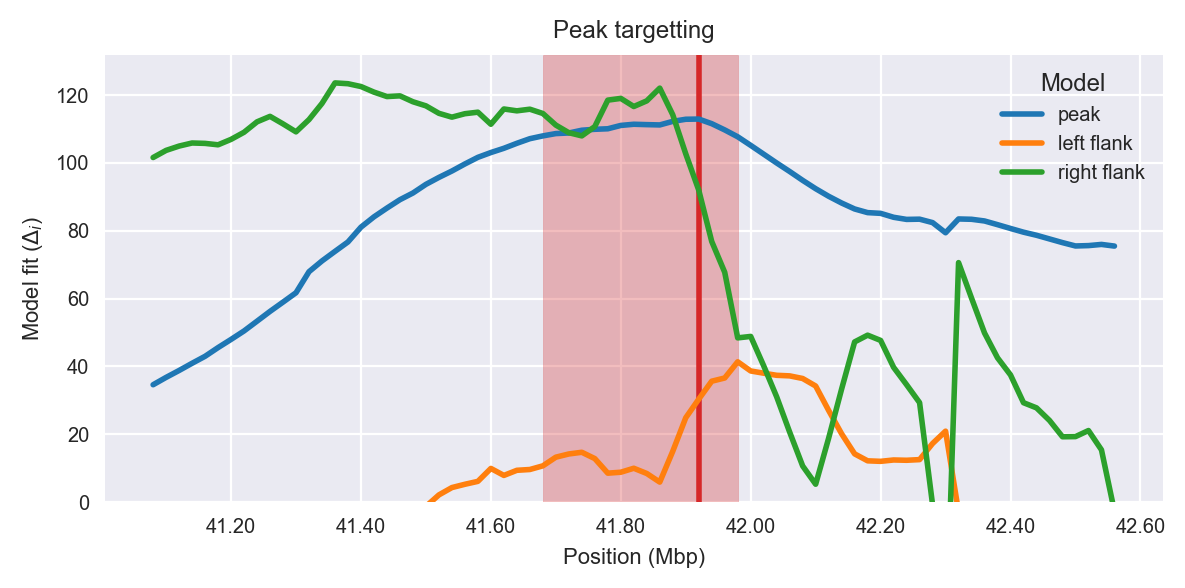
Peak targetting. @@TODO
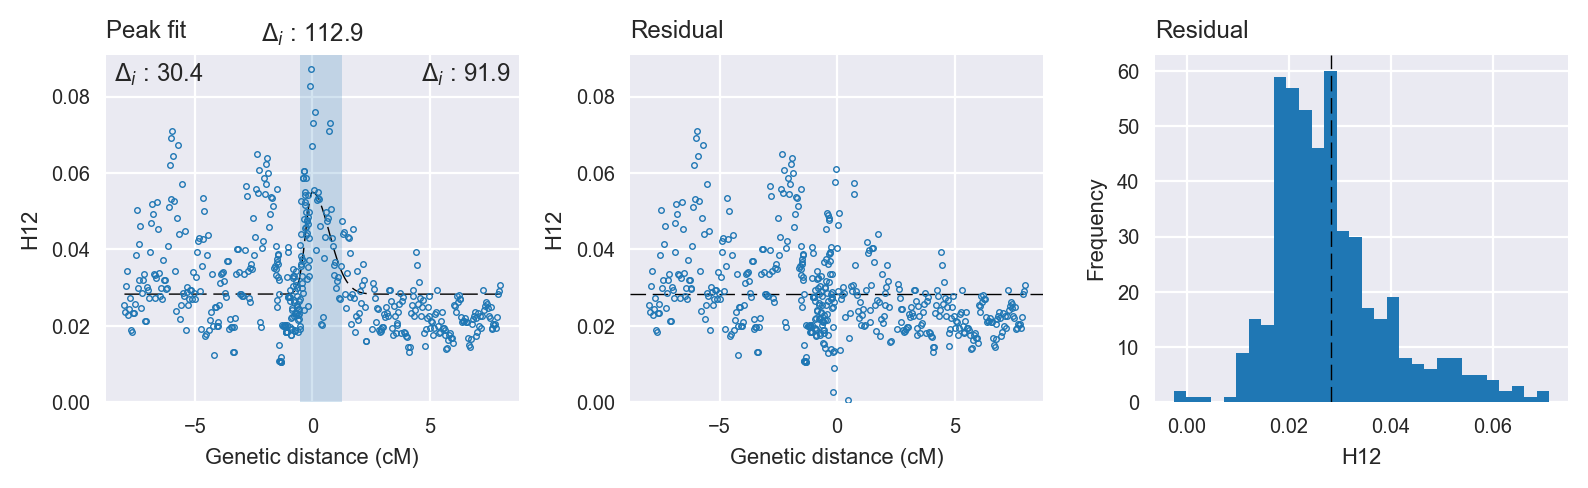
Peak fitting diagnostics. @@TODO
Model fit reports
Peak model:
[[Model]]
    Model(skewed_gaussian)
[[Fit Statistics]]
    # function evals   = 63
    # data points      = 489
    # variables        = 4
    chi-square         = 0.066
    reduced chi-square = 0.000
    Akaike info crit   = -4346.352
    Bayesian info crit = -4329.583
[[Variables]]
    center:      0 (fixed)
    amplitude:   0.02668243 +/- 0.002665 (9.99%) (init= 0.5)
    sigma:       0.45318301 +/- 0.049391 (10.90%) (init= 0.5)
    skew:       -0.65948632 +/- 0.116949 (17.73%) (init= 0)
    baseline:    0.02830380 +/- 0.000605 (2.14%) (init= 0.03)
    ceiling:     1 (fixed)
    floor:       0 (fixed)
[[Correlations]] (unreported correlations are <  0.100)
    C(amplitude, sigma)          = -0.547
    C(sigma, baseline)           = -0.303
    C(sigma, skew)               = -0.180
    C(amplitude, baseline)       = -0.140
Null model:
[[Model]]
    Model(constant)
[[Fit Statistics]]
    # function evals   = 8
    # data points      = 488
    # variables        = 1
    chi-square         = 0.083
    reduced chi-square = 0.000
    Akaike info crit   = -4233.482
    Bayesian info crit = -4229.292
[[Variables]]
    c:   0.03089682 +/- 0.000591 (1.91%) (init= 0.03)