H12/GWA/2/4
This page describes a signal of selection found in the
Guinea Bissau populationusing the H12 (Garud et al. 20XX) statistic.The focus of this signal is on chromosome arm
2R between positions 29,400,000 and
29,640,000.
The evidence supporting this signal is
moderate ( >= 50 on both flanks).
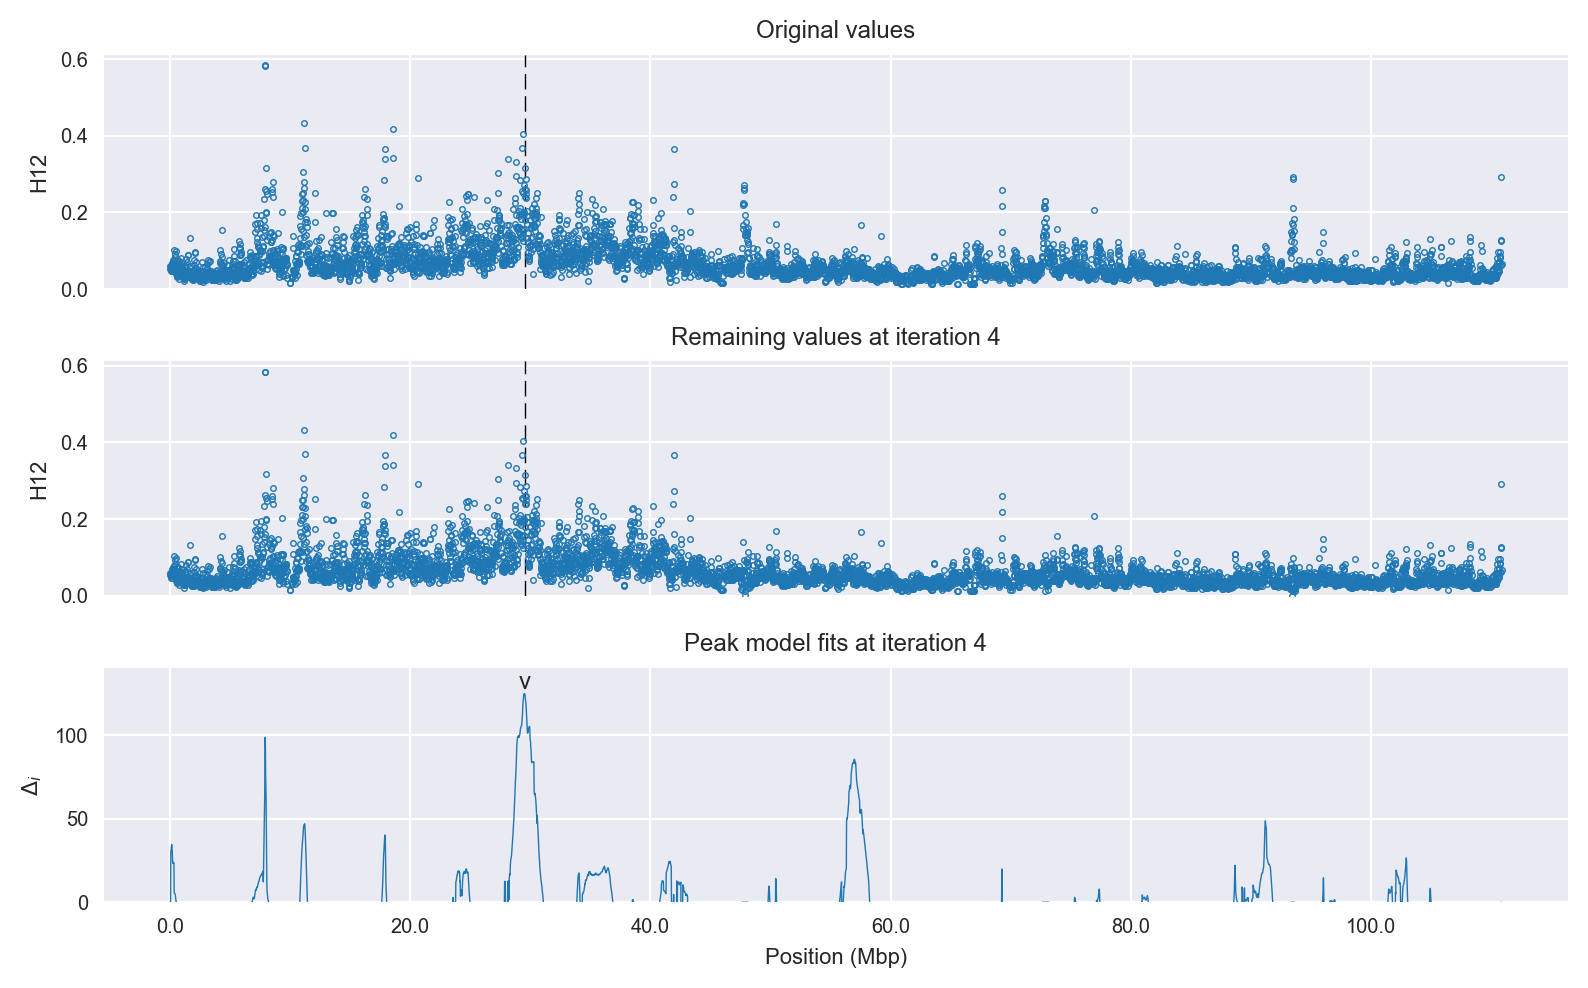
Signal location. Blue markers show the values of the selection statistic. The dashed black line shows the fitted peak model. The shaded red area shows the focus of the selection signal. The shaded blue area shows the genomic region in linkage with the selection event. Use the mouse wheel or the controls at the top right of the plot to zoom in, and hover over genes to see gene names and descriptions.
Genes
The following 9 genes overlap the focal region: AGAP002916, AGAP002917 (mRpL34 - 39S ribosomal protein L34, mitochondrial), AGAP002918, AGAP002919 (RpS6 - 40S ribosomal protein S6), AGAP002920, AGAP002921 (RpL36 - 60S ribosomal protein L36), AGAP002922 (Secretory carrier-associated membrane protein), AGAP002923 (bystin), AGAP002924 (Protein tweety homolog).
The following 3 genes are within 50 kbp of the focal region: AGAP002915, AGAP002925 (poly(U)-specific endoribonuclease), AGAP002926 (epidermal retinal dehydrogenase 2).
Key to insecticide resistance candidate gene types: 1 metabolic; 2 target-site; 3 behavioural; 4 cuticular.
Diagnostics
The information below provides some diagnostics from the Peak modelling algorithm.
Selection signal in context. @@TODO
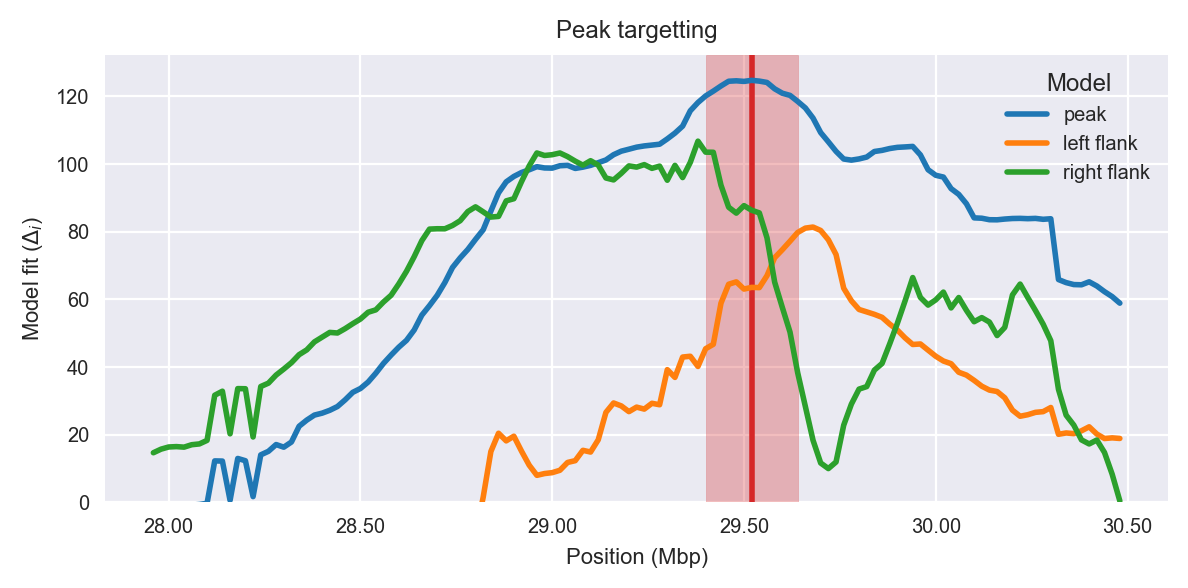
Peak targetting. @@TODO
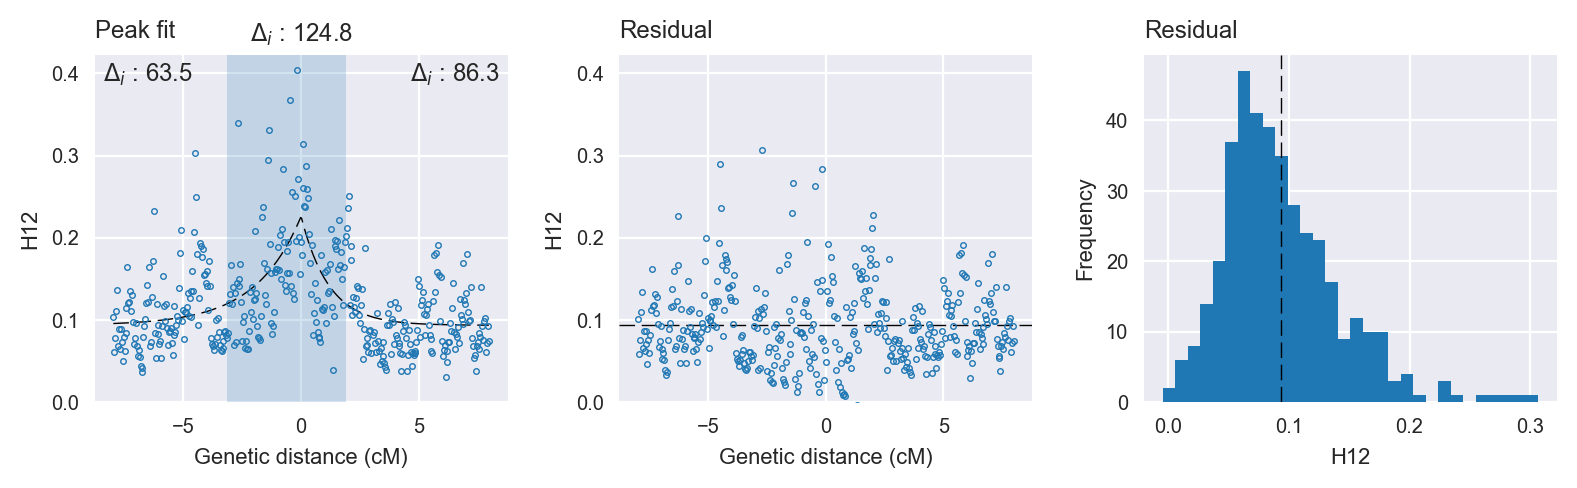
Peak fitting diagnostics. @@TODO
Model fit reports
Peak model:
[[Model]]
    Model(skewed_exponential_peak)
[[Fit Statistics]]
    # function evals   = 48
    # data points      = 399
    # variables        = 4
    chi-square         = 0.935
    reduced chi-square = 0.002
    Akaike info crit   = -2408.202
    Bayesian info crit = -2392.246
[[Variables]]
    center:      0 (fixed)
    amplitude:   0.13245806 +/- 0.011078 (8.36%) (init= 0.5)
    decay:       1.51225065 +/- 0.261109 (17.27%) (init= 0.5)
    skew:        0.35965955 +/- 0.124434 (34.60%) (init= 0)
    baseline:    0.09358941 +/- 0.004466 (4.77%) (init= 0.03)
    ceiling:     1 (fixed)
    floor:       0 (fixed)
[[Correlations]] (unreported correlations are <  0.100)
    C(decay, baseline)           = -0.718
    C(amplitude, decay)          = -0.439
    C(decay, skew)               = -0.154
Null model:
[[Model]]
    Model(constant)
[[Fit Statistics]]
    # function evals   = 12
    # data points      = 398
    # variables        = 1
    chi-square         = 1.277
    reduced chi-square = 0.003
    Akaike info crit   = -2283.447
    Bayesian info crit = -2279.460
[[Variables]]
    c:   0.11846033 +/- 0.002842 (2.40%) (init= 0.03)