IHS/BFM/3/2
This page describes a signal of selection found in the
Burkina Faso An. coluzzii populationusing the IHS (Cite et al. 20XX) statistic.The focus of this signal is on chromosome arm
3R between positions 10,040,000 and
10,100,000.
The evidence supporting this signal is
weak ( < 50 on one or both flanks).
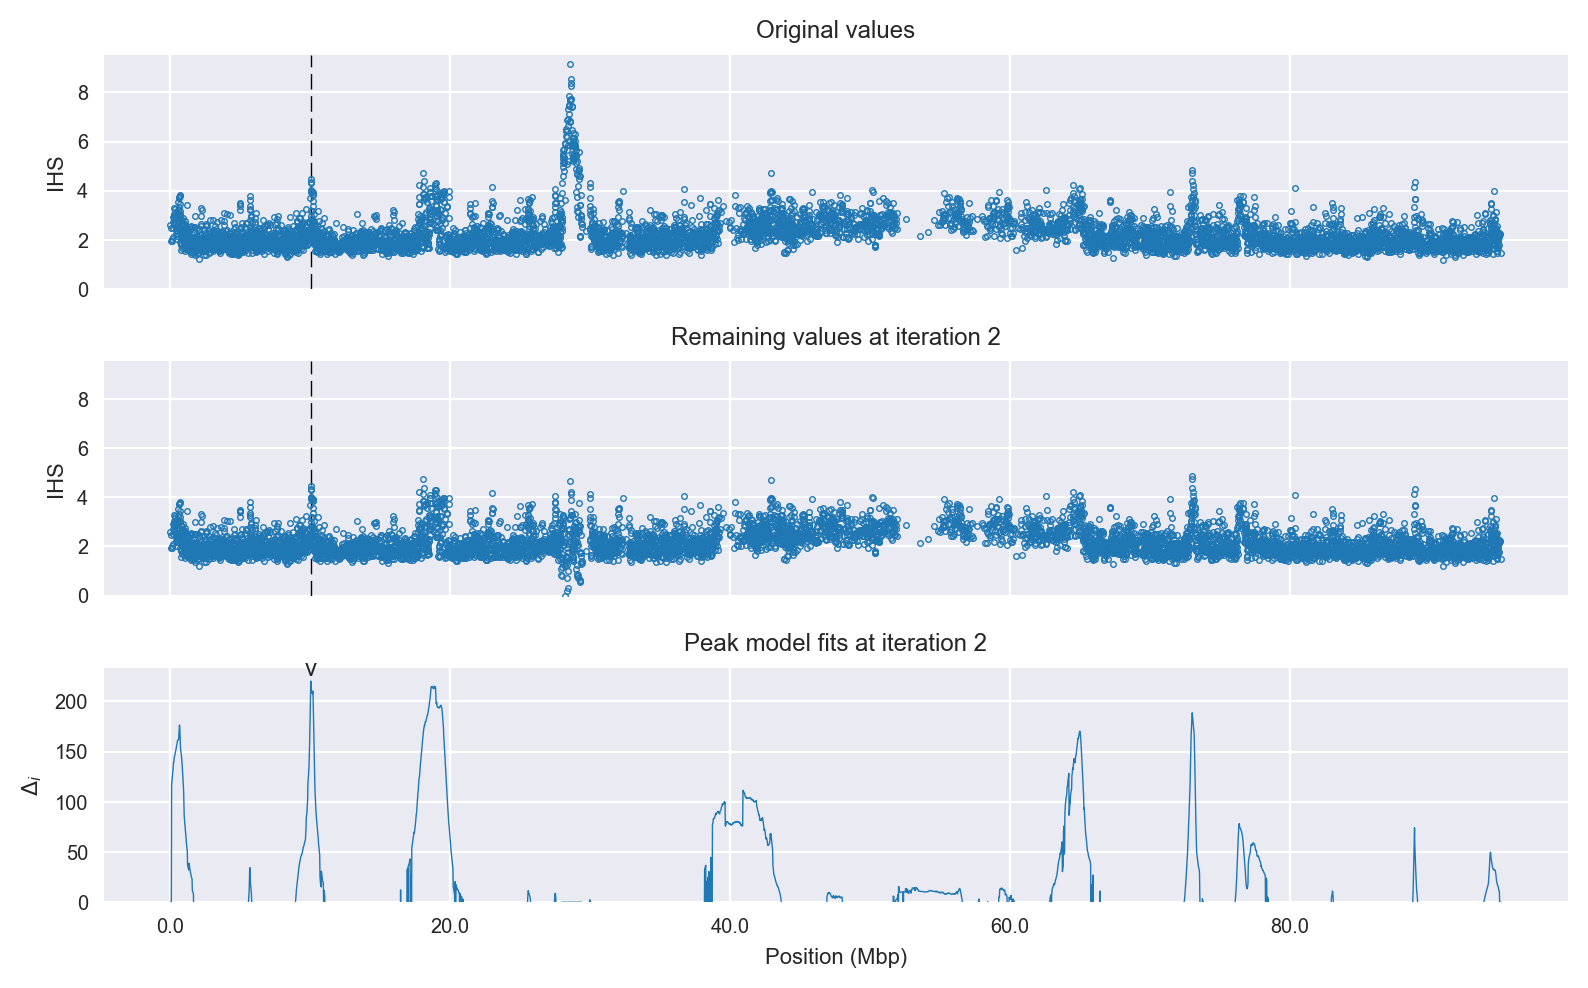
Signal location. Blue markers show the values of the selection statistic. The dashed black line shows the fitted peak model. The shaded red area shows the focus of the selection signal. The shaded blue area shows the genomic region in linkage with the selection event. Use the mouse wheel or the controls at the top right of the plot to zoom in, and hover over genes to see gene names and descriptions.
Genes
The following 11 genes overlap the focal region: AGAP008360 (SPZ3 - spaetzle-like cytokine 3), AGAP008362 (kelch-like protein 2/3), AGAP008363 (cytochrome b5 outer mitochondrial membrane isoform), AGAP008364 (TEP15 - thioester-containing protein 15), AGAP008366 (TEP2 - thioester-containing protein 2), AGAP008368 (TEP14 - thioester-containing protein 14), AGAP008369, AGAP008370 (carboxypeptidase A), AGAP008371, AGAP008372, AGAP008373.
The following 9 genes are within 50 kbp of the focal region: AGAP008359 (sodium-coupled monocarboxylate transporter 1), AGAP028115, AGAP008374 (Inosine triphosphate pyrophosphatase), AGAP008375 (mannose-P-dolichol utilization defect 1), AGAP008376 (mRpL28 - 39S ribosomal protein L28, mitochondrial), AGAP008377 (TBC1 domain family member 19), AGAP008378 (amiloride-sensitive sodium channel, other), AGAP008379, AGAP008380.
Key to insecticide resistance candidate gene types: 1 metabolic; 2 target-site; 3 behavioural; 4 cuticular.
Diagnostics
The information below provides some diagnostics from the Peak modelling algorithm.
Selection signal in context. @@TODO
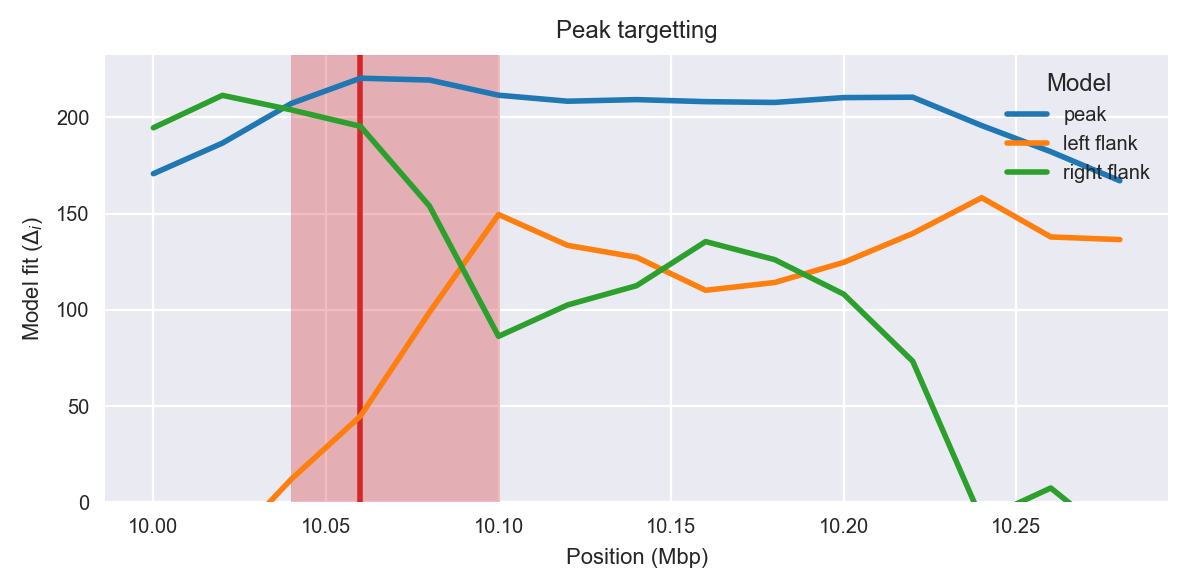
Peak targetting. @@TODO
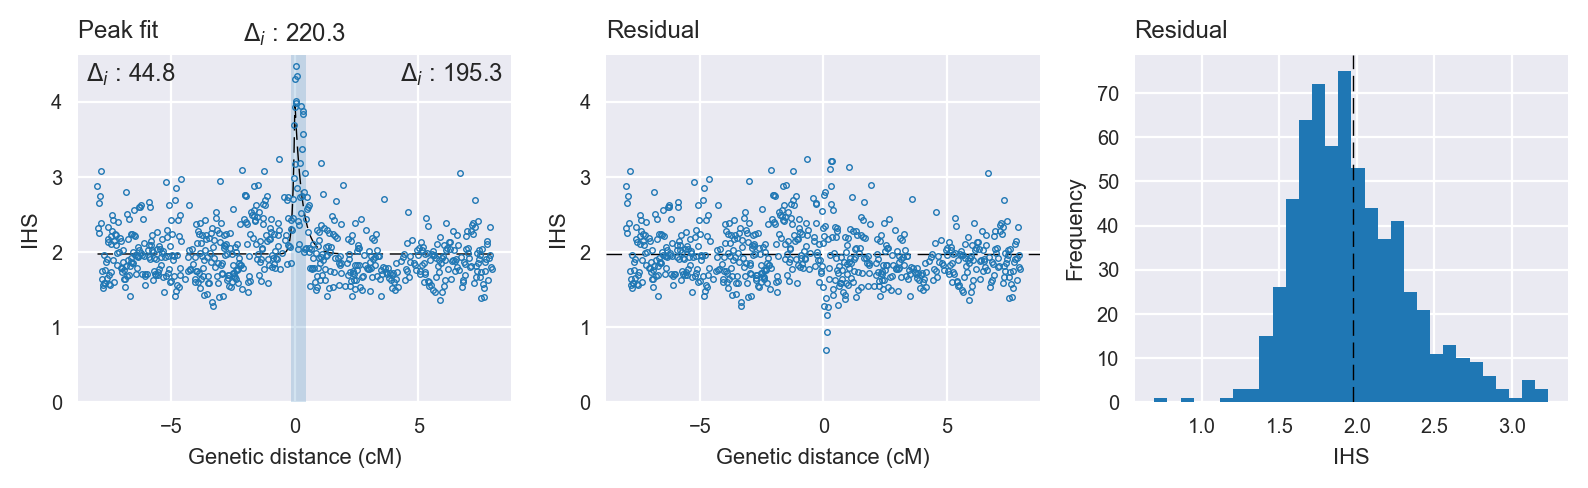
Peak fitting diagnostics. @@TODO
Model fit reports
Peak model:
[[Model]]
    Model(skewed_exponential_peak)
[[Fit Statistics]]
    # function evals   = 58
    # data points      = 647
    # variables        = 4
    chi-square         = 86.464
    reduced chi-square = 0.134
    Akaike info crit   = -1294.167
    Bayesian info crit = -1276.278
[[Variables]]
    center:      0 (fixed)
    amplitude:   2.02496695 +/- 0.153960 (7.60%) (init= 3)
    decay:       0.15878621 +/- 0.021083 (13.28%) (init= 0.5)
    skew:       -0.88929568 +/- 0.148644 (16.71%) (init= 0)
    baseline:    1.97328548 +/- 0.015308 (0.78%) (init= 1)
    ceiling:     100 (fixed)
    floor:       0 (fixed)
[[Correlations]] (unreported correlations are <  0.100)
    C(amplitude, decay)          = -0.593
    C(decay, skew)               =  0.469
    C(decay, baseline)           = -0.210
Null model:
[[Model]]
    Model(constant)
[[Fit Statistics]]
    # function evals   = 11
    # data points      = 646
    # variables        = 1
    chi-square         = 122.171
    reduced chi-square = 0.189
    Akaike info crit   = -1073.836
    Bayesian info crit = -1069.365
[[Variables]]
    c:   2.03331204 +/- 0.017123 (0.84%) (init= 1)