IHS/BFS/2/8
This page describes a signal of selection found in the
Burkina Faso An. gambiae populationusing the IHS (Cite et al. 20XX) statistic.The focus of this signal is on chromosome arm
2L between positions 37,274,895 and
37,594,895.
The evidence supporting this signal is
weak ( < 50 on one or both flanks).
Signal location. Blue markers show the values of the selection statistic. The dashed black line shows the fitted peak model. The shaded red area shows the focus of the selection signal. The shaded blue area shows the genomic region in linkage with the selection event. Use the mouse wheel or the controls at the top right of the plot to zoom in, and hover over genes to see gene names and descriptions.
Genes
The following 16 genes overlap the focal region: AGAP0067231 (COEAE2G - carboxylesterase), AGAP006724 (COEAE3G - carboxylesterase), AGAP0067251 (COEAE3H - carboxylesterase alpha esterase), AGAP006726 (COEAE5G - carboxylesterase), AGAP0067271 (COEAE6G - carboxylesterase), AGAP006728 (COEAE7G - carboxylesterase), AGAP006729 (Ester hydrolase C11orf54), AGAP006730, AGAP006731, AGAP006732, AGAP006733 (Thoc4 - THO complex subunit 4), AGAP006734 (DNA-repair protein XRCC2), AGAP006735, AGAP006736 (zinc finger protein GLIS2), AGAP028461, AGAP006737.
The following 4 genes are within 50 kbp of the focal region: AGAP006721, AGAP006722 (CEC4 - cecropin anti-microbial peptide), AGAP006738, AGAP006739.
Key to insecticide resistance candidate gene types: 1 metabolic; 2 target-site; 3 behavioural; 4 cuticular.
Diagnostics
The information below provides some diagnostics from the Peak modelling algorithm.
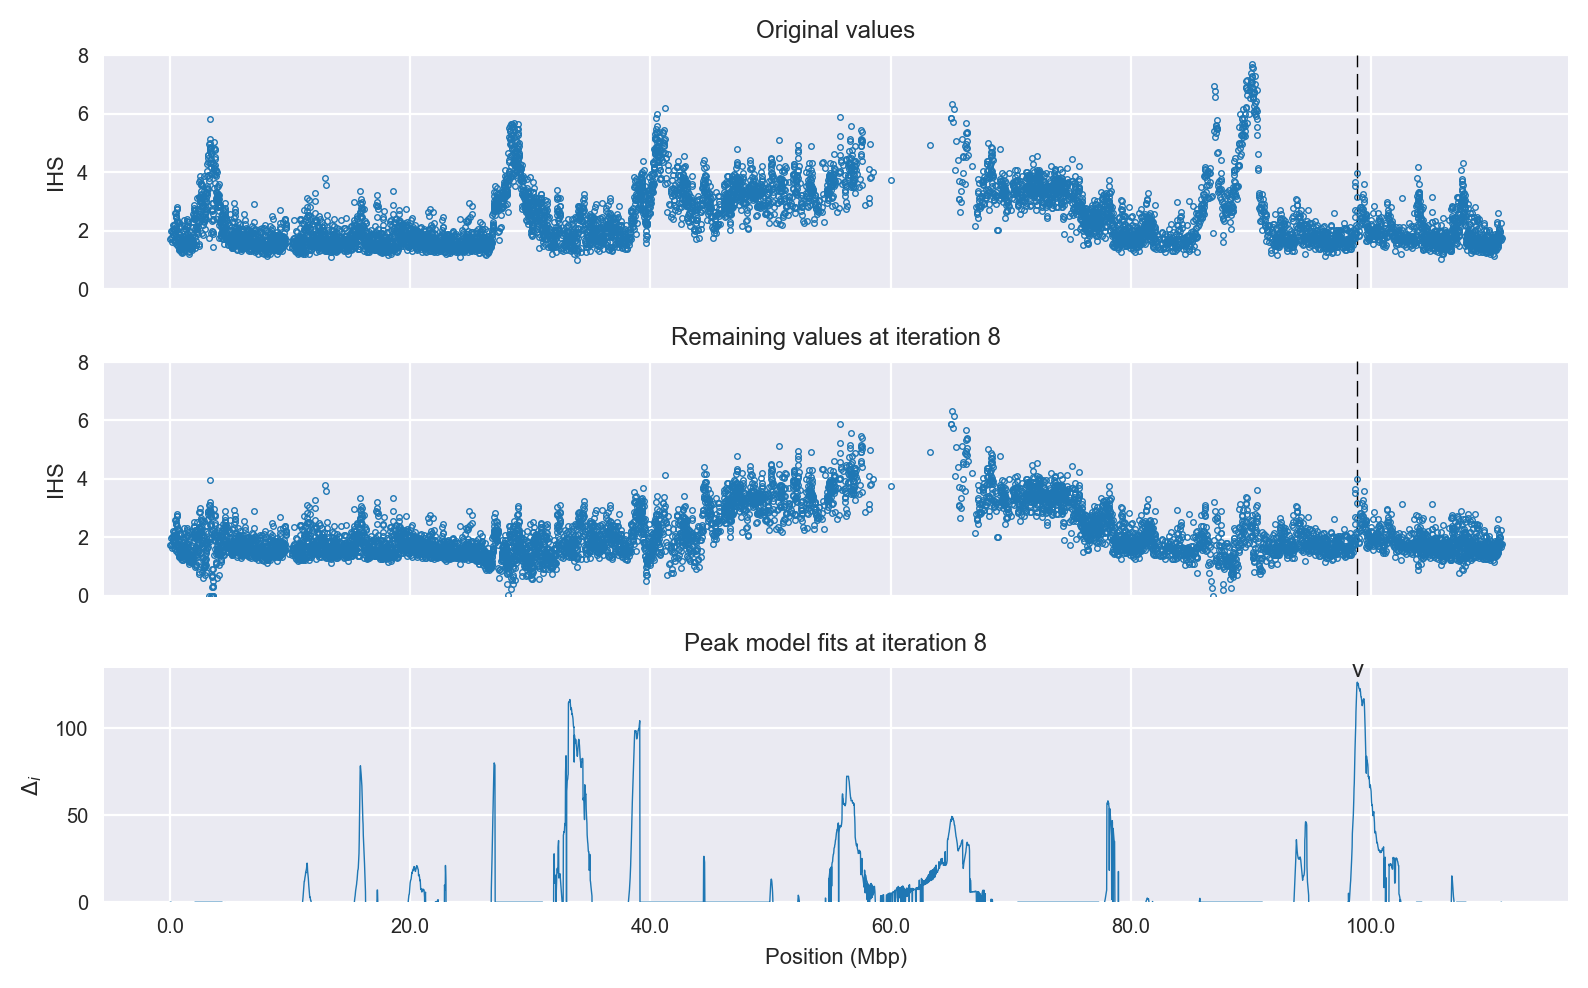
Selection signal in context. @@TODO
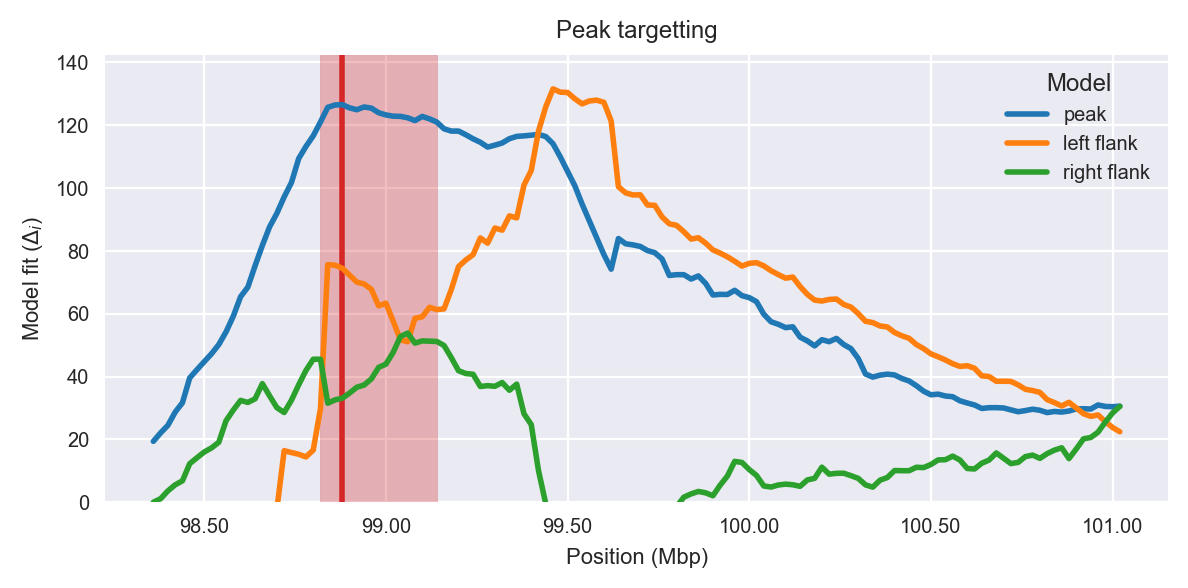
Peak targetting. @@TODO
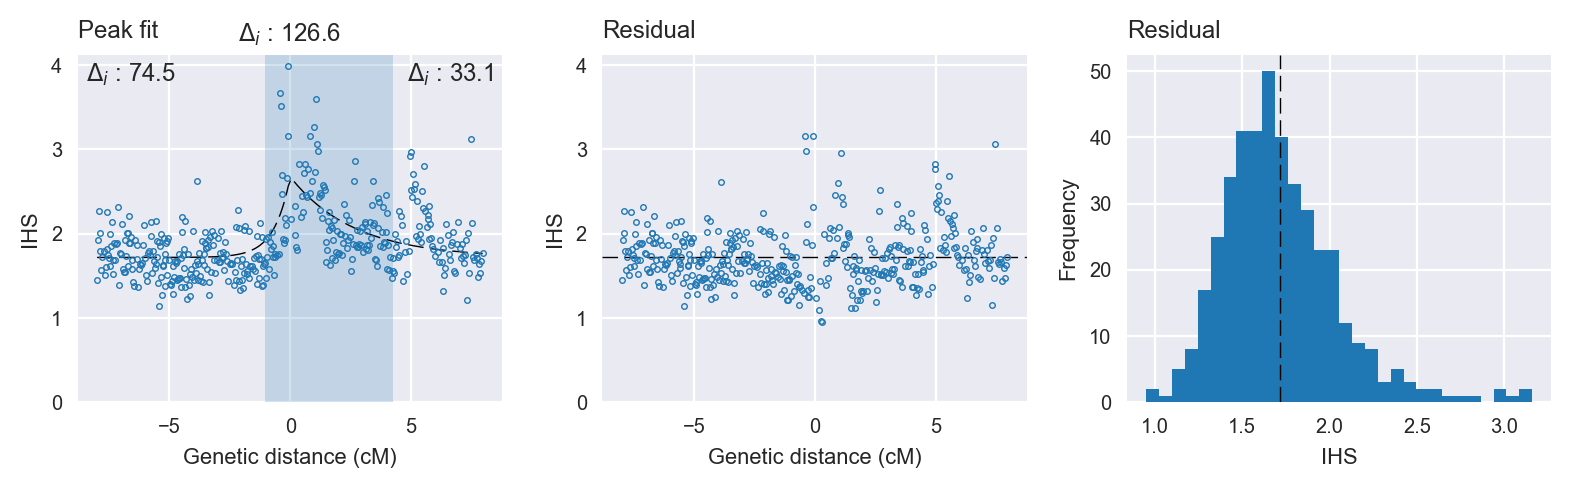
Peak fitting diagnostics. @@TODO
Model fit reports
Peak model:
[[Model]]
    Model(skewed_exponential_peak)
[[Fit Statistics]]
    # function evals   = 79
    # data points      = 424
    # variables        = 4
    chi-square         = 47.288
    reduced chi-square = 0.113
    Akaike info crit   = -922.035
    Bayesian info crit = -905.836
[[Variables]]
    center:      0 (fixed)
    amplitude:   0.95590686 +/- 0.085201 (8.91%) (init= 3)
    decay:       1.32106245 +/- 0.209733 (15.88%) (init= 0.5)
    skew:       -1          +/- 0.002535 (0.25%) (init= 0)
    baseline:    1.71717194 +/- 0.025482 (1.48%) (init= 1)
    ceiling:     100 (fixed)
    floor:       0 (fixed)
[[Correlations]] (unreported correlations are <  0.100)
    C(decay, baseline)           = -0.583
    C(amplitude, decay)          = -0.528
    C(decay, skew)               =  0.357
    C(skew, baseline)            = -0.100
Null model:
[[Model]]
    Model(constant)
[[Fit Statistics]]
    # function evals   = 11
    # data points      = 423
    # variables        = 1
    chi-square         = 64.206
    reduced chi-square = 0.152
    Akaike info crit   = -795.474
    Bayesian info crit = -791.427
[[Variables]]
    c:   1.88330114 +/- 0.018965 (1.01%) (init= 1)