IHS/BFS/X/1
This page describes a signal of selection found in the
Burkina Faso An. gambiae populationusing the IHS (Cite et al. 20XX) statistic.The focus of this signal is on chromosome arm
X between positions 9,160,000 and
9,680,000.
The evidence supporting this signal is
strong ( >= 100 on both flanks).
Signal location. Blue markers show the values of the selection statistic. The dashed black line shows the fitted peak model. The shaded red area shows the focus of the selection signal. The shaded blue area shows the genomic region in linkage with the selection event. Use the mouse wheel or the controls at the top right of the plot to zoom in, and hover over genes to see gene names and descriptions.
Genes
The following 25 genes overlap the focal region: AGAP000519 (diacylglycerol kinase (ATP dependent)), AGAP000520, AGAP000521, AGAP000522, AGAP000523 (F-type H -transporting ATPase subunit c), AGAP000526 (translation initiation factor 4B), AGAP000528, AGAP000529 (vacuolar protein sorting-associated protein 16-like protein), AGAP000530 (Werner Syndrome-like exonuclease), AGAP000531 (lipoyl(octanoyl) transferase), AGAP000532 (histone deacetylase 6/10), AGAP013259 (RNA-binding protein MEX3), AGAP013283, AGAP000533, AGAP000534 (glutathione synthase), AGAP013287, AGAP000535, AGAP028592, AGAP012976, AGAP013521, AGAP000536 (PGRPS1 - peptidoglycan recognition protein (short)), AGAP000537 (TWDL8 - cuticular protein TWDL family (TWDL8)), AGAP000538 (TWDL9 - cuticular protein TWDL family (TWDL9)), AGAP000539, AGAP000540 (proton-coupled amino acid transporter).
The following 4 genes are within 50 kbp of the focal region: AGAP000515 (enhancer of rudimentary protein), AGAP000516 (enhancer of rudimentary protein), AGAP000541 (RpS15a-1 - 40S ribosomal protein S15a), AGAP013055.
Key to insecticide resistance candidate gene types: 1 metabolic; 2 target-site; 3 behavioural; 4 cuticular.
Overlapping selection signals
The following selection signals have a focus which overlaps with the focus of this signal.
| Signal | Statistic | Population | Focus | Peak model |
Max. percentile | Known locus |
|---|---|---|---|---|---|---|
| XPEHH/BFS.BFM/X/1 | XPEHH | Burkina Faso An. gambiae | X:9,200,000-9,240,000 | 848 | 97.6% | nan |
| XPEHH/BFS.GWA/X/2 | XPEHH | Burkina Faso An. gambiae | X:9,200,000-9,240,000 | 744 | 99.5% | nan |
| XPEHH/BFS.UGS/X/2 | XPEHH | Burkina Faso An. gambiae | X:9,220,000-9,260,000 | 678 | 99.8% | nan |
| H12/BFS/X/2 | H12 | Burkina Faso An. gambiae | X:9,180,000-9,240,000 | 563 | 97.8% | nan |
| IHS/BFM/X/2 | IHS | Burkina Faso An. coluzzii | X:9,040,000-9,300,000 | 394 | 97.4% | nan |
| H12/BFS/X/3 | H12 | Burkina Faso An. gambiae | X:9,660,000-9,760,000 | 267 | 91.6% | nan |
| H12/BFM/X/2 | H12 | Burkina Faso An. coluzzii | X:9,220,000-9,260,000 | 221 | 96.9% | nan |
| XPEHH/BFS.BFM/X/2 | XPEHH | Burkina Faso An. gambiae | X:9,660,000-9,700,000 | 214 | 88.0% | nan |
| XPEHH/BFM.GWA/X/2 | XPEHH | Burkina Faso An. coluzzii | X:9,200,000-9,240,000 | 186 | 71.7% | nan |
| XPEHH/BFS.UGS/X/3 | XPEHH | Burkina Faso An. gambiae | X:9,660,000-9,700,000 | 183 | 97.8% | nan |
| XPEHH/GWA.BFM/X/1 | XPEHH | Guinea Bissau | X:9,560,000-9,600,000 | 115 | 84.9% | nan |
| XPEHH/GWA.UGS/X/1 | XPEHH | Guinea Bissau | X:9,560,000-9,600,000 | 105 | 99.9% | nan |
| XPEHH/BFS.GWA/X/3 | XPEHH | Burkina Faso An. gambiae | X:9,660,000-9,700,000 | 97 | 91.2% | nan |
Diagnostics
The information below provides some diagnostics from the Peak modelling algorithm.
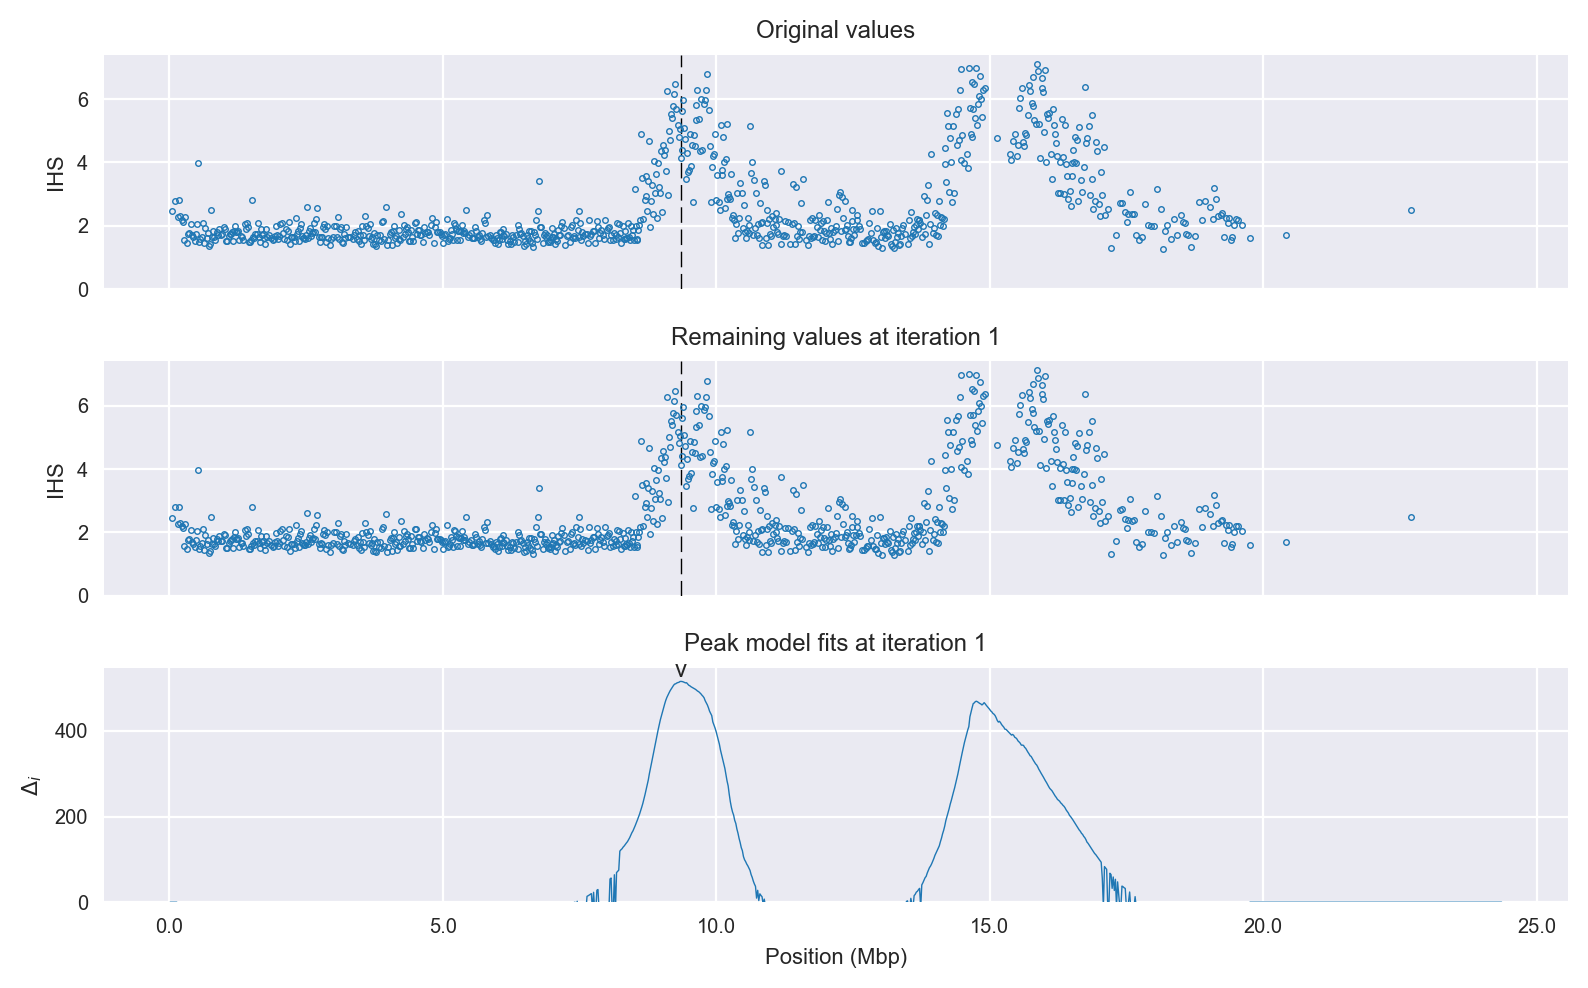
Selection signal in context. @@TODO
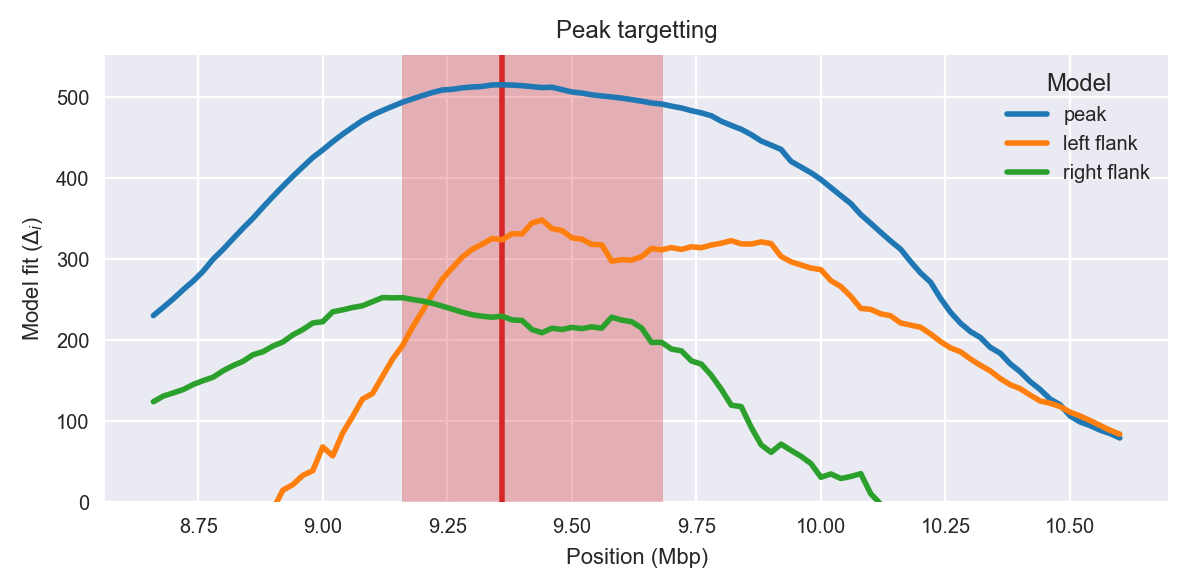
Peak targetting. @@TODO
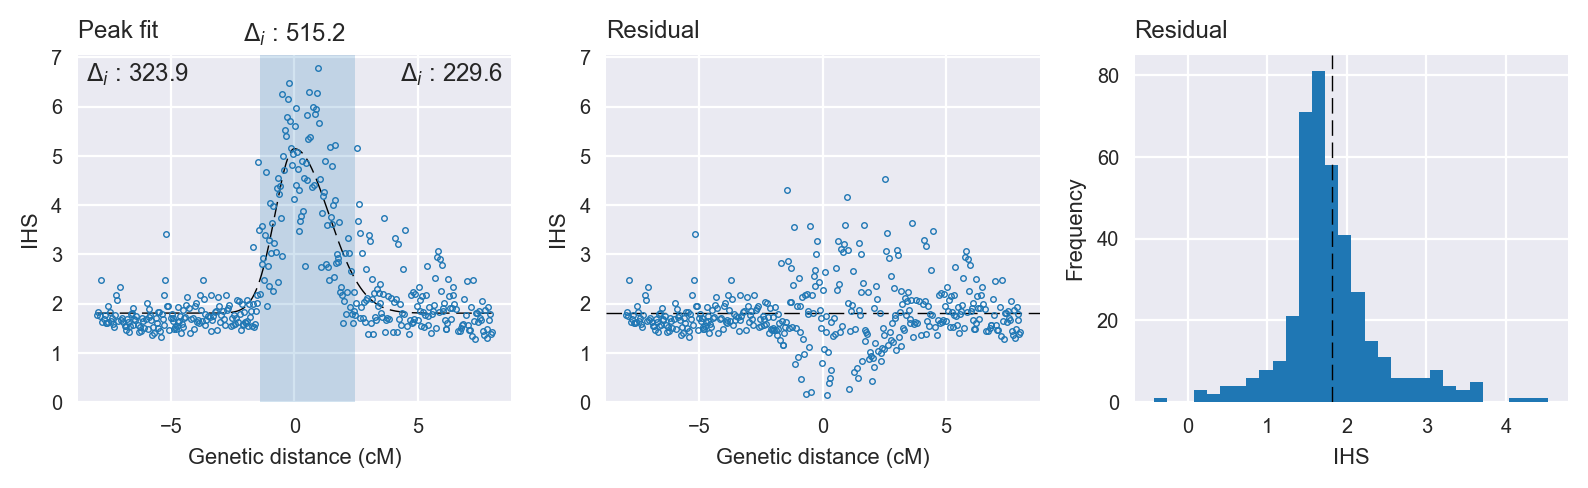
Peak fitting diagnostics. @@TODO
Model fit reports
Peak model:
[[Model]]
    Model(skewed_gaussian)
[[Fit Statistics]]
    # function evals   = 28
    # data points      = 404
    # variables        = 4
    chi-square         = 155.096
    reduced chi-square = 0.388
    Akaike info crit   = -378.778
    Bayesian info crit = -362.772
[[Variables]]
    center:      0 (fixed)
    amplitude:   3.33819706 +/- 0.109650 (3.28%) (init= 3)
    sigma:       1.04140932 +/- 0.042279 (4.06%) (init= 0.5)
    skew:       -0.41253640 +/- 0.044309 (10.74%) (init= 0)
    baseline:    1.80854200 +/- 0.039538 (2.19%) (init= 1)
    ceiling:     100 (fixed)
    floor:       0 (fixed)
[[Correlations]] (unreported correlations are <  0.100)
    C(sigma, baseline)           = -0.407
    C(amplitude, sigma)          = -0.389
    C(amplitude, baseline)       = -0.259
    C(sigma, skew)               =  0.213
Null model:
[[Model]]
    Model(constant)
[[Fit Statistics]]
    # function evals   = 11
    # data points      = 403
    # variables        = 1
    chi-square         = 562.522
    reduced chi-square = 1.399
    Akaike info crit   = 136.398
    Bayesian info crit = 140.397
[[Variables]]
    c:   2.40341320 +/- 0.058925 (2.45%) (init= 1)