IHS/GAS/3/1
This page describes a signal of selection found in the
Gabon An. gambiae populationusing the IHS (Cite et al. 20XX) statistic.The focus of this signal is on chromosome arm
3R between positions 44,140,000 and
44,300,000.
The evidence supporting this signal is
moderate ( >= 50 on both flanks).
Signal location. Blue markers show the values of the selection statistic. The dashed black line shows the fitted peak model. The shaded red area shows the focus of the selection signal. The shaded blue area shows the genomic region in linkage with the selection event. Use the mouse wheel or the controls at the top right of the plot to zoom in, and hover over genes to see gene names and descriptions.
Genes
The following 2 genes overlap the focal region: AGAP009848, AGAP009849 (SP14D1).
The following 12 genes are within 50 kbp of the focal region: AGAP009840 (USO1 vesicle docking protein homolog), AGAP009841, AGAP009842 (ribonuclease T2), AGAP009843, AGAP009844 (CLIPB15 - CLIP-domain serine protease), AGAP009845, AGAP009846 (Ras-related protein Rab-9A), AGAP009847 (Outspread), AGAP009850 (ABCG7 - ATP-binding cassette transporter (ABC transporter) family G member 7), AGAP009851, AGAP009852 (mitochondrial fission 1 protein), AGAP0098533 (Gr5 - gustatory receptor 5).
Key to insecticide resistance candidate gene types: 1 metabolic; 2 target-site; 3 behavioural; 4 cuticular.
Overlapping selection signals
The following selection signals have a focus which overlaps with the focus of this signal.
| Signal | Statistic | Population | Focus | Peak model |
Max. percentile | Known locus |
|---|---|---|---|---|---|---|
| XPEHH/CMS.GAS/3/1 | XPEHH | Cameroon An. gambiae | 3R:43,920,000-44,560,000 | 538 | 99.5% | nan |
| XPEHH/AOM.BFM/3/1 | XPEHH | Angola An. coluzzii | 3R:43,860,000-44,500,000 | 314 | 99.7% | nan |
| IHS/AOM/3/1 | IHS | Angola An. coluzzii | 3R:43,740,000-44,560,000 | 112 | 99.2% | nan |
Diagnostics
The information below provides some diagnostics from the Peak modelling algorithm.
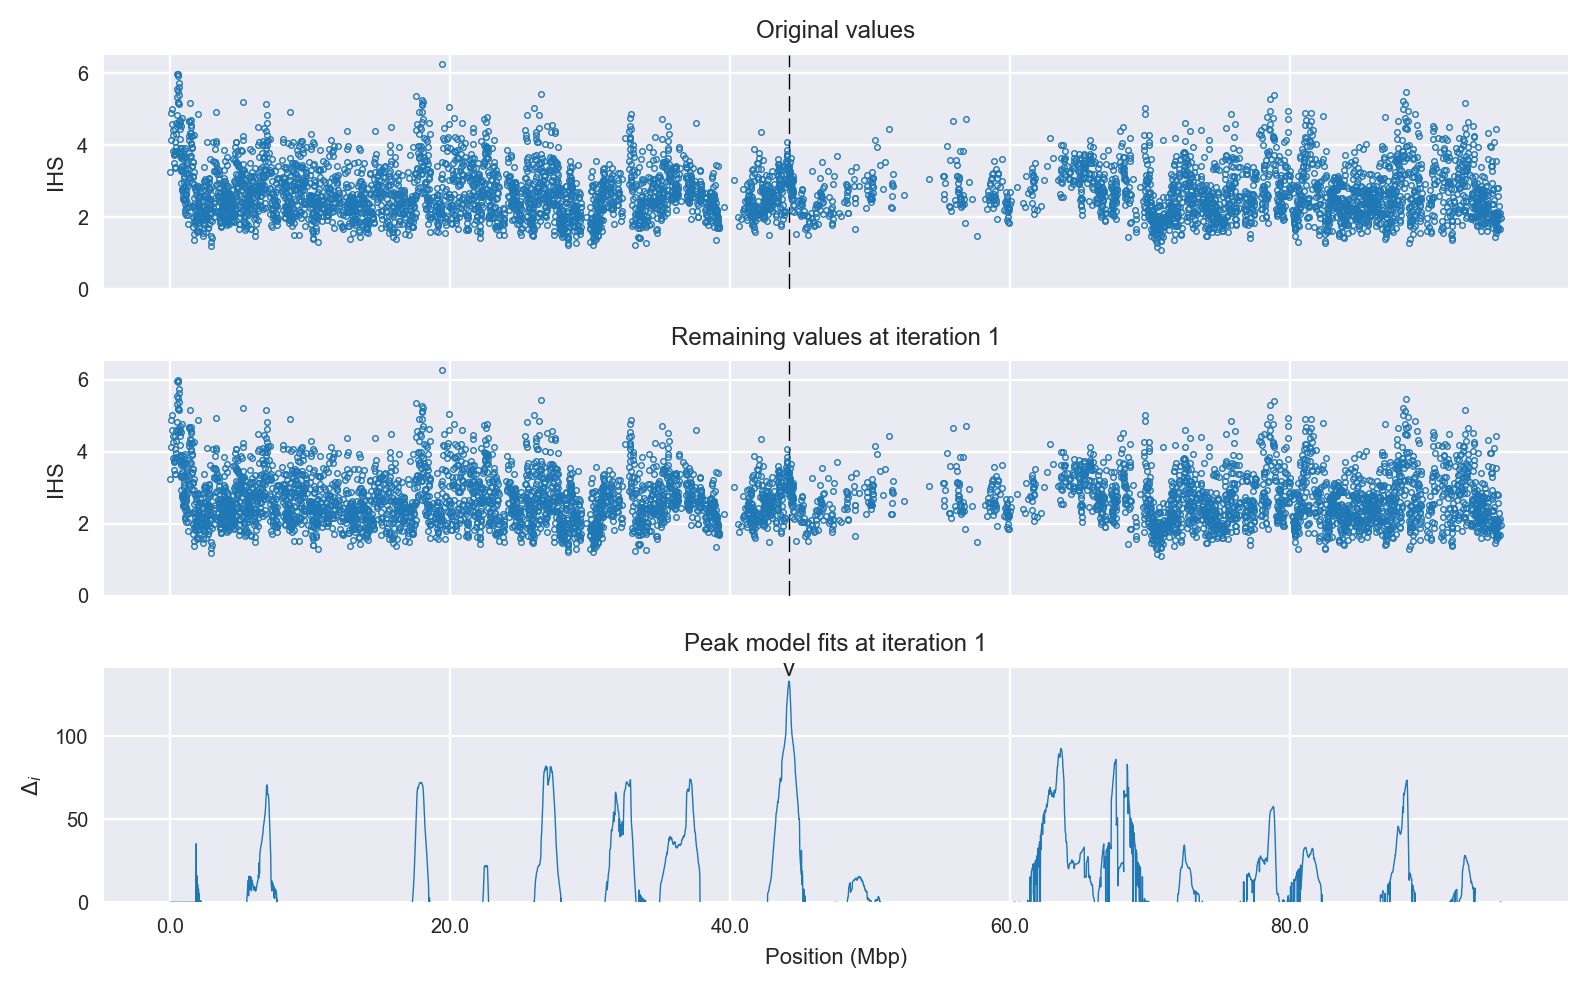
Selection signal in context. @@TODO
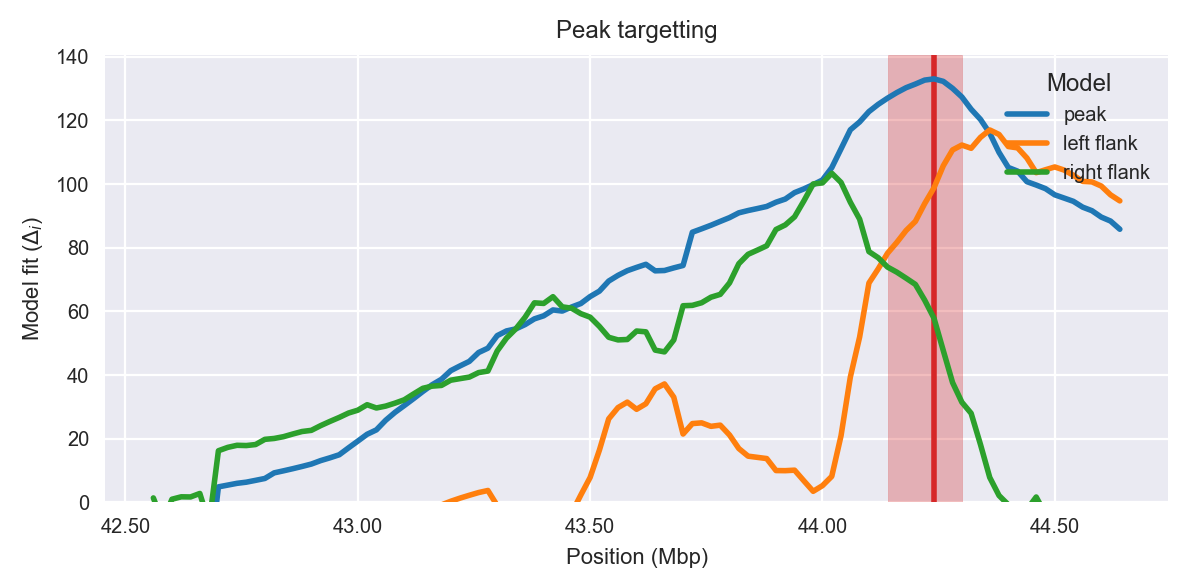
Peak targetting. @@TODO
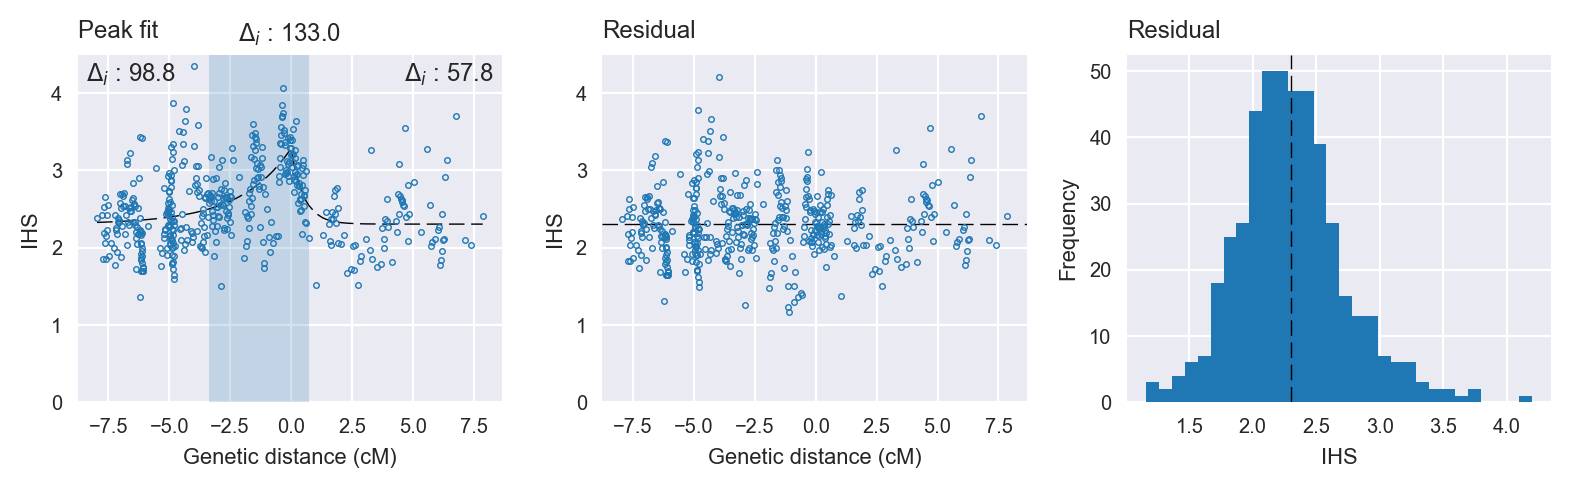
Peak fitting diagnostics. @@TODO
Model fit reports
Peak model:
[[Model]]
    Model(skewed_exponential_peak)
[[Fit Statistics]]
    # function evals   = 47
    # data points      = 468
    # variables        = 4
    chi-square         = 86.118
    reduced chi-square = 0.186
    Akaike info crit   = -784.208
    Bayesian info crit = -767.614
[[Variables]]
    center:      0 (fixed)
    amplitude:   0.97748687 +/- 0.078093 (7.99%) (init= 3)
    decay:       1.04724593 +/- 0.207456 (19.81%) (init= 0.5)
    skew:        0.99999520 +/- 0.171506 (17.15%) (init= 0)
    baseline:    2.30342580 +/- 0.041091 (1.78%) (init= 1)
    ceiling:     100 (fixed)
    floor:       0 (fixed)
[[Correlations]] (unreported correlations are <  0.100)
    C(decay, baseline)           = -0.653
    C(decay, skew)               = -0.427
    C(amplitude, decay)          = -0.316
    C(amplitude, baseline)       = -0.229
    C(amplitude, skew)           =  0.196
Null model:
[[Model]]
    Model(constant)
[[Fit Statistics]]
    # function evals   = 11
    # data points      = 467
    # variables        = 1
    chi-square         = 115.312
    reduced chi-square = 0.247
    Akaike info crit   = -651.188
    Bayesian info crit = -647.042
[[Variables]]
    c:   2.53428770 +/- 0.023018 (0.91%) (init= 1)