IHS/GWA/2/1
This page describes a signal of selection found in the
Guinea Bissau populationusing the IHS (Cite et al. 20XX) statistic.The focus of this signal is on chromosome arm
2R between positions 47,780,000 and
47,940,000.
The evidence supporting this signal is
weak ( < 50 on one or both flanks).
Signal location. Blue markers show the values of the selection statistic. The dashed black line shows the fitted peak model. The shaded red area shows the focus of the selection signal. The shaded blue area shows the genomic region in linkage with the selection event. Use the mouse wheel or the controls at the top right of the plot to zoom in, and hover over genes to see gene names and descriptions.
Genes
The following 24 genes overlap the focal region: AGAP004002 (60 kDa heat shock protein, mitochondrial precursor), AGAP013015 (p53 and DNA damage-regulated protein), AGAP004003, AGAP004004, AGAP004005, AGAP013019, AGAP004006, AGAP004007, AGAP004008, AGAP004011 (survival motor neuron protein), AGAP004012 (katanin p60 ATPase-containing subunit), AGAP0040131 (SP11838), AGAP0040141 (SP11706), AGAP0040151 (SP21408), AGAP013186, AGAP004017, AGAP004016, AGAP004018, AGAP004020 (alpha-mannosidase II), AGAP0040212 (IR40a - ionotropic receptor IR40a), AGAP004022, AGAP004023 (APG4A - autophagy related gene), AGAP004028 (intron-binding protein aquarius), AGAP004025 (GPRMTH5 - methuselah receptor 5).
The following 6 genes are within 50 kbp of the focal region: AGAP003997 (casein kinase 1, gamma), AGAP004000 (myosin IX), AGAP004026 (GPRMTH6 - methuselah receptor 6), AGAP004029 (DNA excision repair protein ERCC-1), AGAP004030 (dynein light intermediate chain, axonemal), AGAP0040311 (mitochondrial electron transfer flavoprotein subunit alpha).
Key to insecticide resistance candidate gene types: 1 metabolic; 2 target-site; 3 behavioural; 4 cuticular.
Overlapping selection signals
The following selection signals have a focus which overlaps with the focus of this signal.
| Signal | Statistic | Population | Focus | Peak model |
Max. percentile | Known locus |
|---|---|---|---|---|---|---|
| H12/GWA/2/2 | H12 | Guinea Bissau | 2R:47,740,000-47,800,000 | 380 | 98.9% | nan |
| XPEHH/GWA.BFM/2/2 | XPEHH | Guinea Bissau | 2R:47,760,000-47,800,000 | 303 | 99.9% | nan |
| XPEHH/GWA.BFS/2/3 | XPEHH | Guinea Bissau | 2R:47,760,000-47,800,000 | 167 | 98.6% | nan |
| XPEHH/GWA.UGS/2/2 | XPEHH | Guinea Bissau | 2R:47,740,000-47,800,000 | 113 | 95.0% | nan |
Diagnostics
The information below provides some diagnostics from the Peak modelling algorithm.
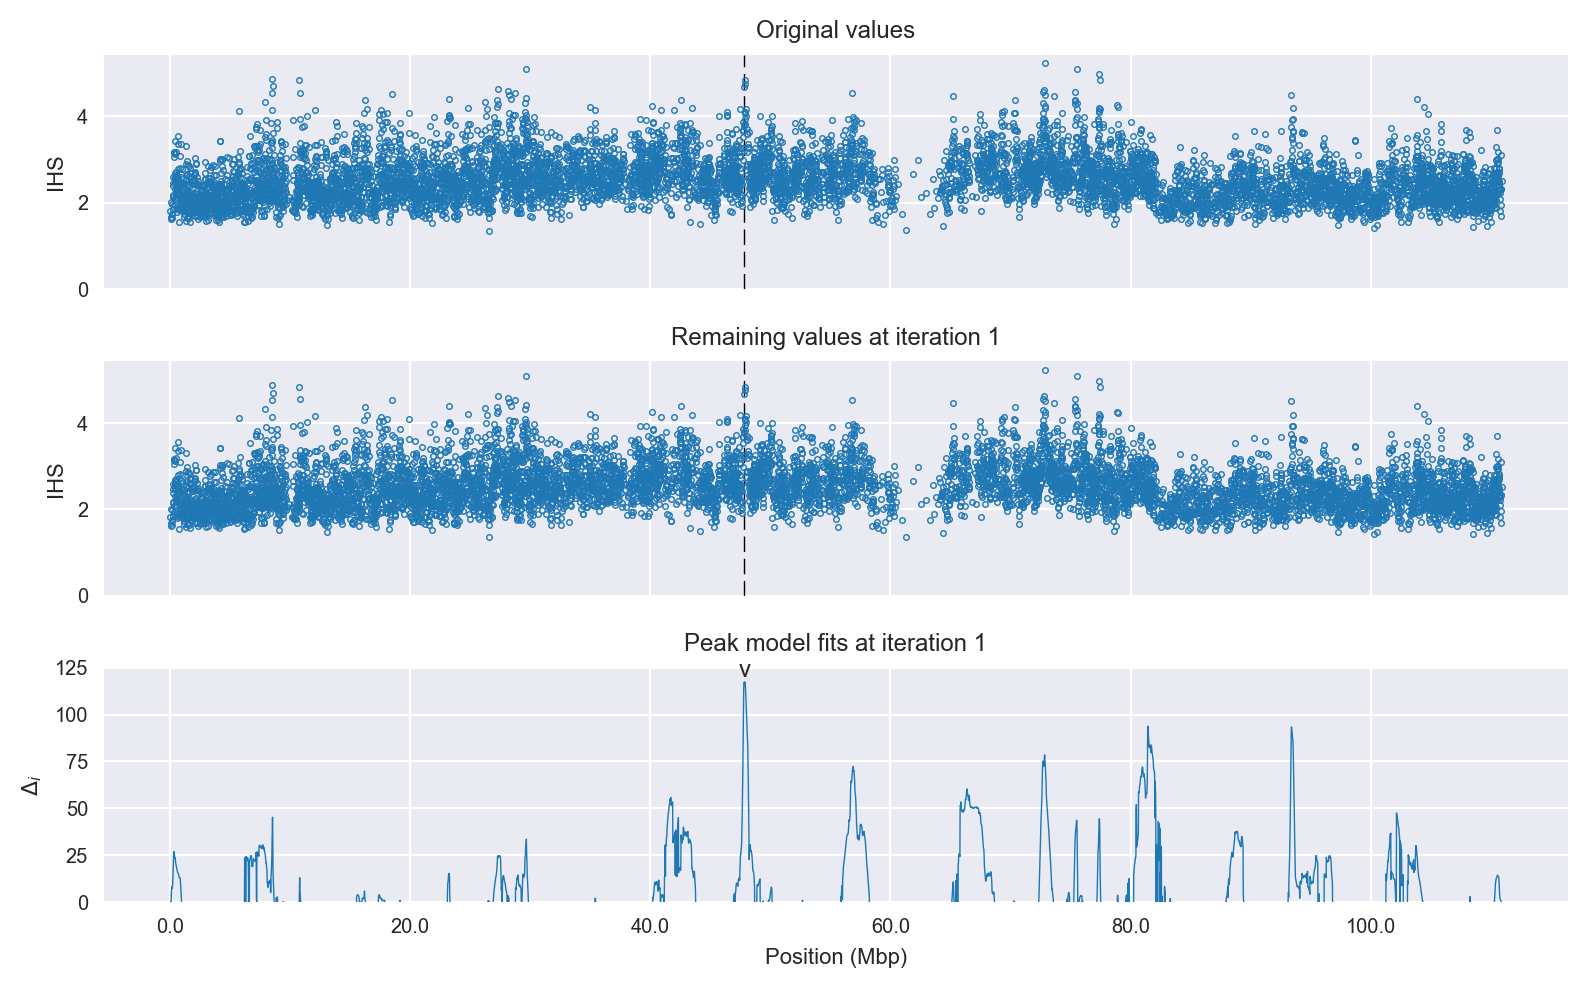
Selection signal in context. @@TODO
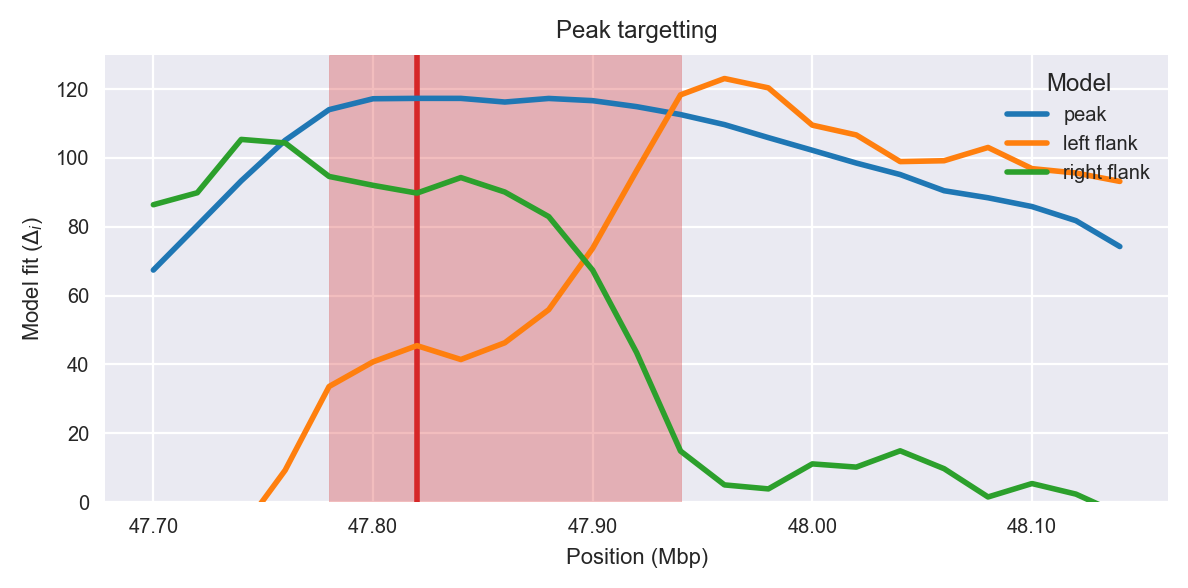
Peak targetting. @@TODO
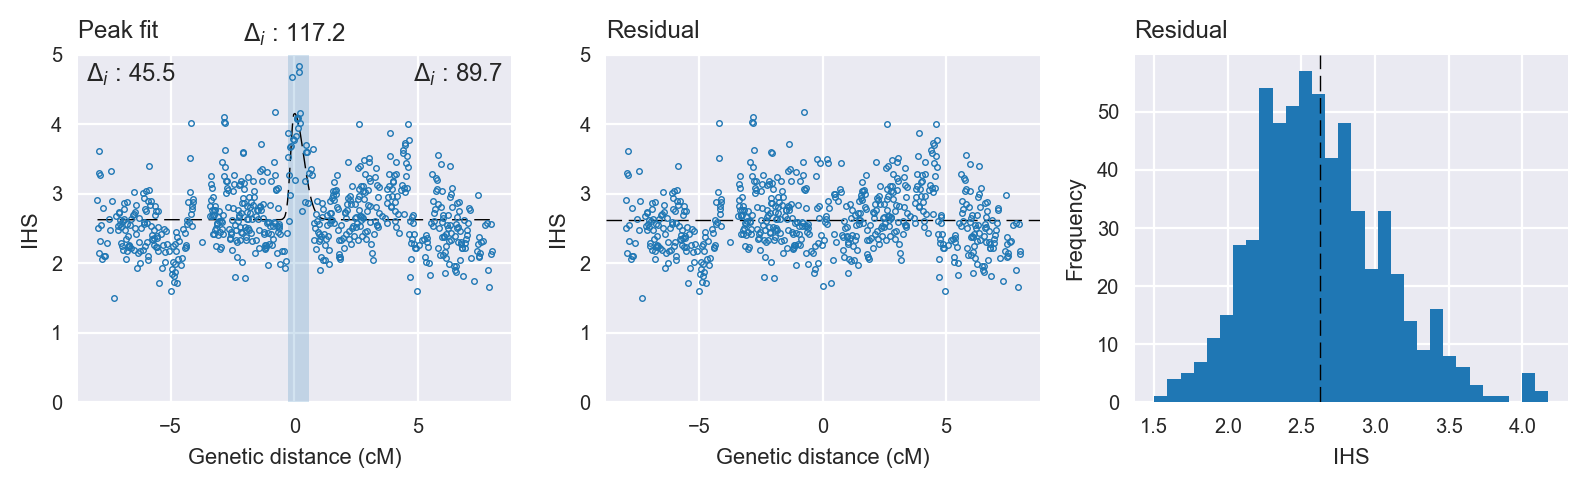
Peak fitting diagnostics. @@TODO
Model fit reports
Peak model:
[[Model]]
    Model(skewed_gaussian)
[[Fit Statistics]]
    # function evals   = 73
    # data points      = 627
    # variables        = 4
    chi-square         = 125.249
    reduced chi-square = 0.201
    Akaike info crit   = -1001.871
    Bayesian info crit = -984.107
[[Variables]]
    center:      0 (fixed)
    amplitude:   1.53392061 +/- 0.146643 (9.56%) (init= 3)
    sigma:       0.23358693 +/- 0.026595 (11.39%) (init= 0.5)
    skew:       -0.69812739 +/- 0.135442 (19.40%) (init= 0)
    baseline:    2.62652769 +/- 0.018580 (0.71%) (init= 1)
    ceiling:     100 (fixed)
    floor:       0 (fixed)
[[Correlations]] (unreported correlations are <  0.100)
    C(amplitude, sigma)          = -0.529
    C(sigma, skew)               =  0.214
    C(sigma, baseline)           = -0.157
Null model:
[[Model]]
    Model(constant)
[[Fit Statistics]]
    # function evals   = 11
    # data points      = 626
    # variables        = 1
    chi-square         = 151.868
    reduced chi-square = 0.243
    Akaike info crit   = -884.628
    Bayesian info crit = -880.189
[[Variables]]
    c:   2.67141259 +/- 0.019701 (0.74%) (init= 1)