IHS/GWA/2/2
This page describes a signal of selection found in the
Guinea Bissau populationusing the IHS (Cite et al. 20XX) statistic.The focus of this signal is on chromosome arm
2L between positions 31,834,895 and
31,914,895.
The evidence supporting this signal is
weak ( < 50 on one or both flanks).
Signal location. Blue markers show the values of the selection statistic. The dashed black line shows the fitted peak model. The shaded red area shows the focus of the selection signal. The shaded blue area shows the genomic region in linkage with the selection event. Use the mouse wheel or the controls at the top right of the plot to zoom in, and hover over genes to see gene names and descriptions.
Genes
The following 5 genes overlap the focal region: AGAP006436 (Med13 - mediator of RNA polymerase II transcription subunit 13), AGAP028457, AGAP006437, AGAP006438 (ribosomal biogenesis protein LAS1), AGAP006439 (fringe).
The following 6 genes are within 50 kbp of the focal region: AGAP006431 (F-box and leucine-rich repeat protein 6), AGAP006432, AGAP006433, AGAP006434, AGAP006435, AGAP006440 (IR136 - ionotropic receptor IR136).
Key to insecticide resistance candidate gene types: 1 metabolic; 2 target-site; 3 behavioural; 4 cuticular.
Overlapping selection signals
The following selection signals have a focus which overlaps with the focus of this signal.
| Signal | Statistic | Population | Focus | Peak model |
Max. percentile | Known locus |
|---|---|---|---|---|---|---|
| XPEHH/GWA.UGS/2/1 | XPEHH | Guinea Bissau | 2L:31,914,895-32,034,895 | 430 | 93.3% | nan |
| XPEHH/GWA.BFS/2/2 | XPEHH | Guinea Bissau | 2L:31,874,895-32,014,895 | 261 | 97.3% | nan |
Diagnostics
The information below provides some diagnostics from the Peak modelling algorithm.
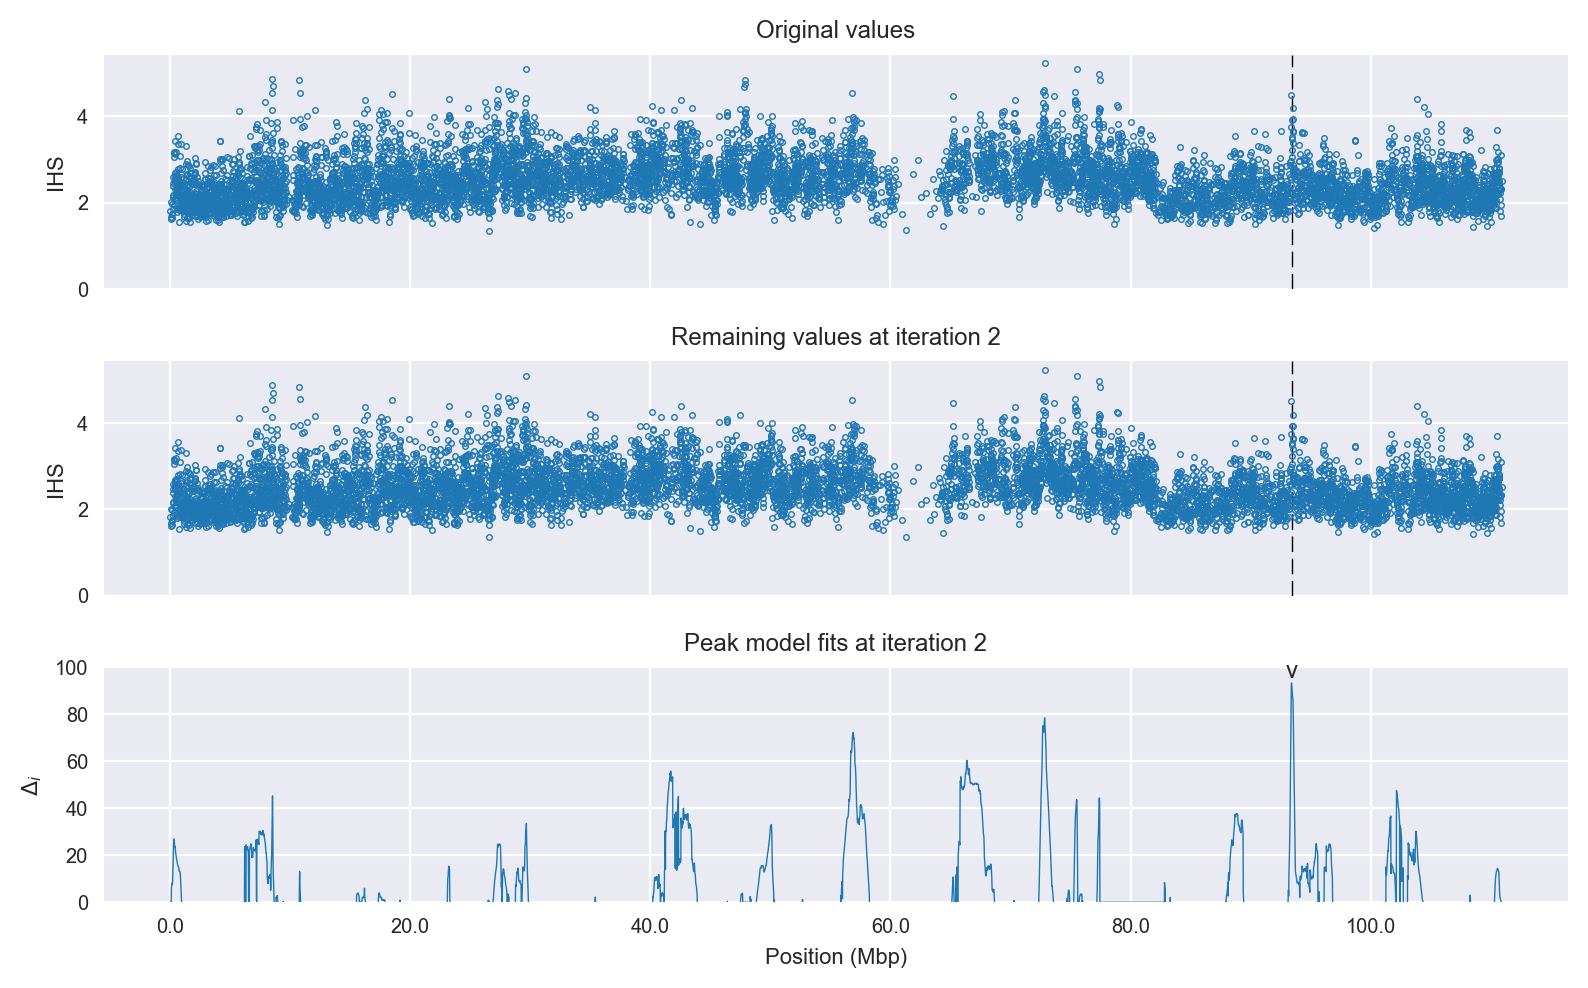
Selection signal in context. @@TODO
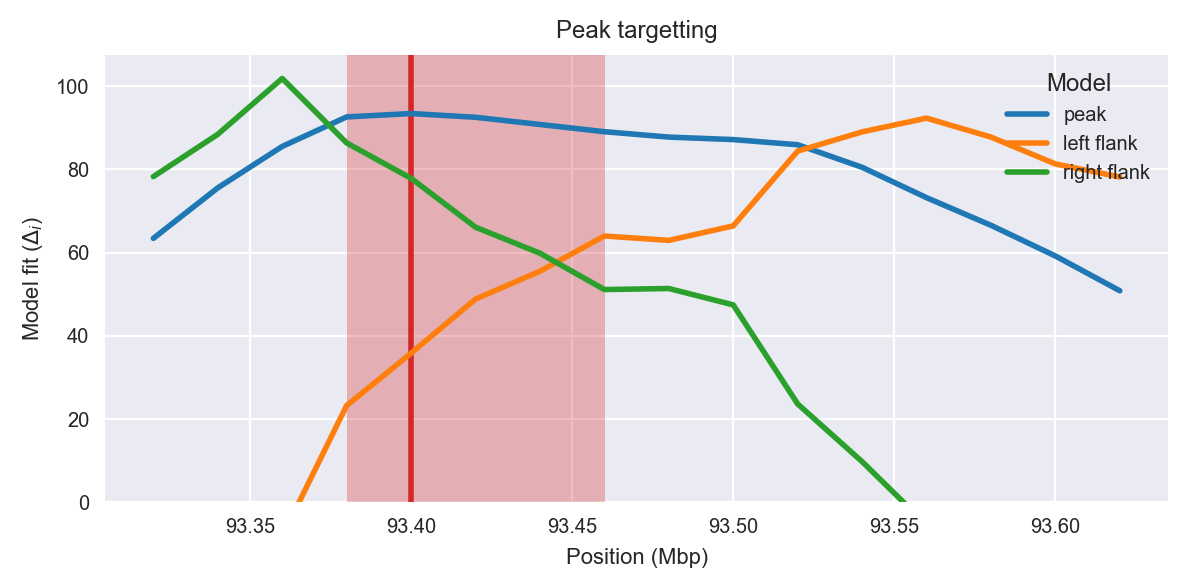
Peak targetting. @@TODO
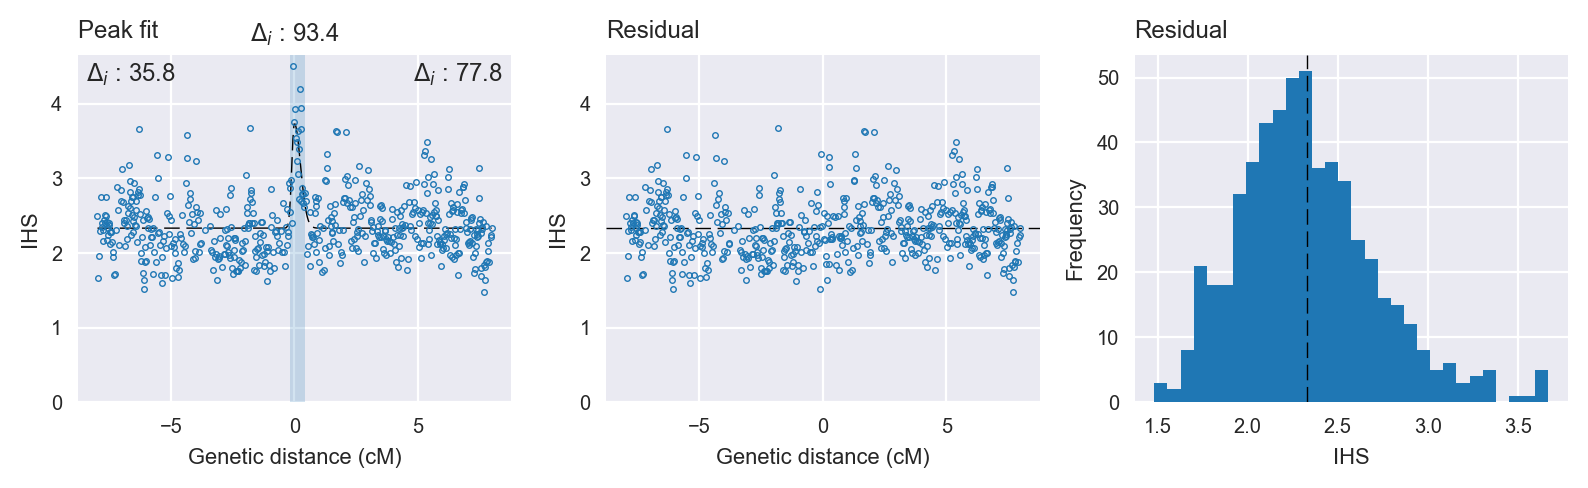
Peak fitting diagnostics. @@TODO
Model fit reports
Peak model:
[[Model]]
    Model(skewed_gaussian)
[[Fit Statistics]]
    # function evals   = 33
    # data points      = 563
    # variables        = 4
    chi-square         = 83.934
    reduced chi-square = 0.150
    Akaike info crit   = -1063.530
    Bayesian info crit = -1046.196
[[Variables]]
    center:      0 (fixed)
    amplitude:   1.40621902 +/- 0.155152 (11.03%) (init= 3)
    sigma:       0.15835577 +/- 0.021146 (13.35%) (init= 0.5)
    skew:       -0.64816543 +/- 0.157106 (24.24%) (init= 0)
    baseline:    2.33173434 +/- 0.016813 (0.72%) (init= 1)
    ceiling:     100 (fixed)
    floor:       0 (fixed)
[[Correlations]] (unreported correlations are <  0.100)
    C(amplitude, sigma)          = -0.555
    C(sigma, skew)               =  0.351
    C(sigma, baseline)           = -0.127
Null model:
[[Model]]
    Model(constant)
[[Fit Statistics]]
    # function evals   = 11
    # data points      = 562
    # variables        = 1
    chi-square         = 99.656
    reduced chi-square = 0.178
    Akaike info crit   = -970.138
    Bayesian info crit = -965.806
[[Variables]]
    c:   2.36655939 +/- 0.017778 (0.75%) (init= 1)