IHS/UGS/2/3
This page describes a signal of selection found in the
Uganda An. gambiae populationusing the IHS (Cite et al. 20XX) statistic.The focus of this signal is on chromosome arm
2L between positions 14,914,895 and
15,074,895.
The evidence supporting this signal is
moderate ( >= 50 on both flanks).
Signal location. Blue markers show the values of the selection statistic. The dashed black line shows the fitted peak model. The shaded red area shows the focus of the selection signal. The shaded blue area shows the genomic region in linkage with the selection event. Use the mouse wheel or the controls at the top right of the plot to zoom in, and hover over genes to see gene names and descriptions.
Genes
The following 6 genes overlap the focal region: AGAP005394, AGAP005396, AGAP005397, AGAP005398, AGAP005399, AGAP005400 (four and a half LIM domains).
The following 5 genes are within 50 kbp of the focal region: AGAP005391 (ATP-dependent RNA helicase DDX20), AGAP005392 (post-GPI attachment to proteins factor 3 precursor), AGAP005393 (Ras-related protein Rab-2A), AGAP005401 (karyopherin (Importin) alpha 6), AGAP005402 (coiled-coil domain-containing protein 58).
Key to insecticide resistance candidate gene types: 1 metabolic; 2 target-site; 3 behavioural; 4 cuticular.
Diagnostics
The information below provides some diagnostics from the Peak modelling algorithm.
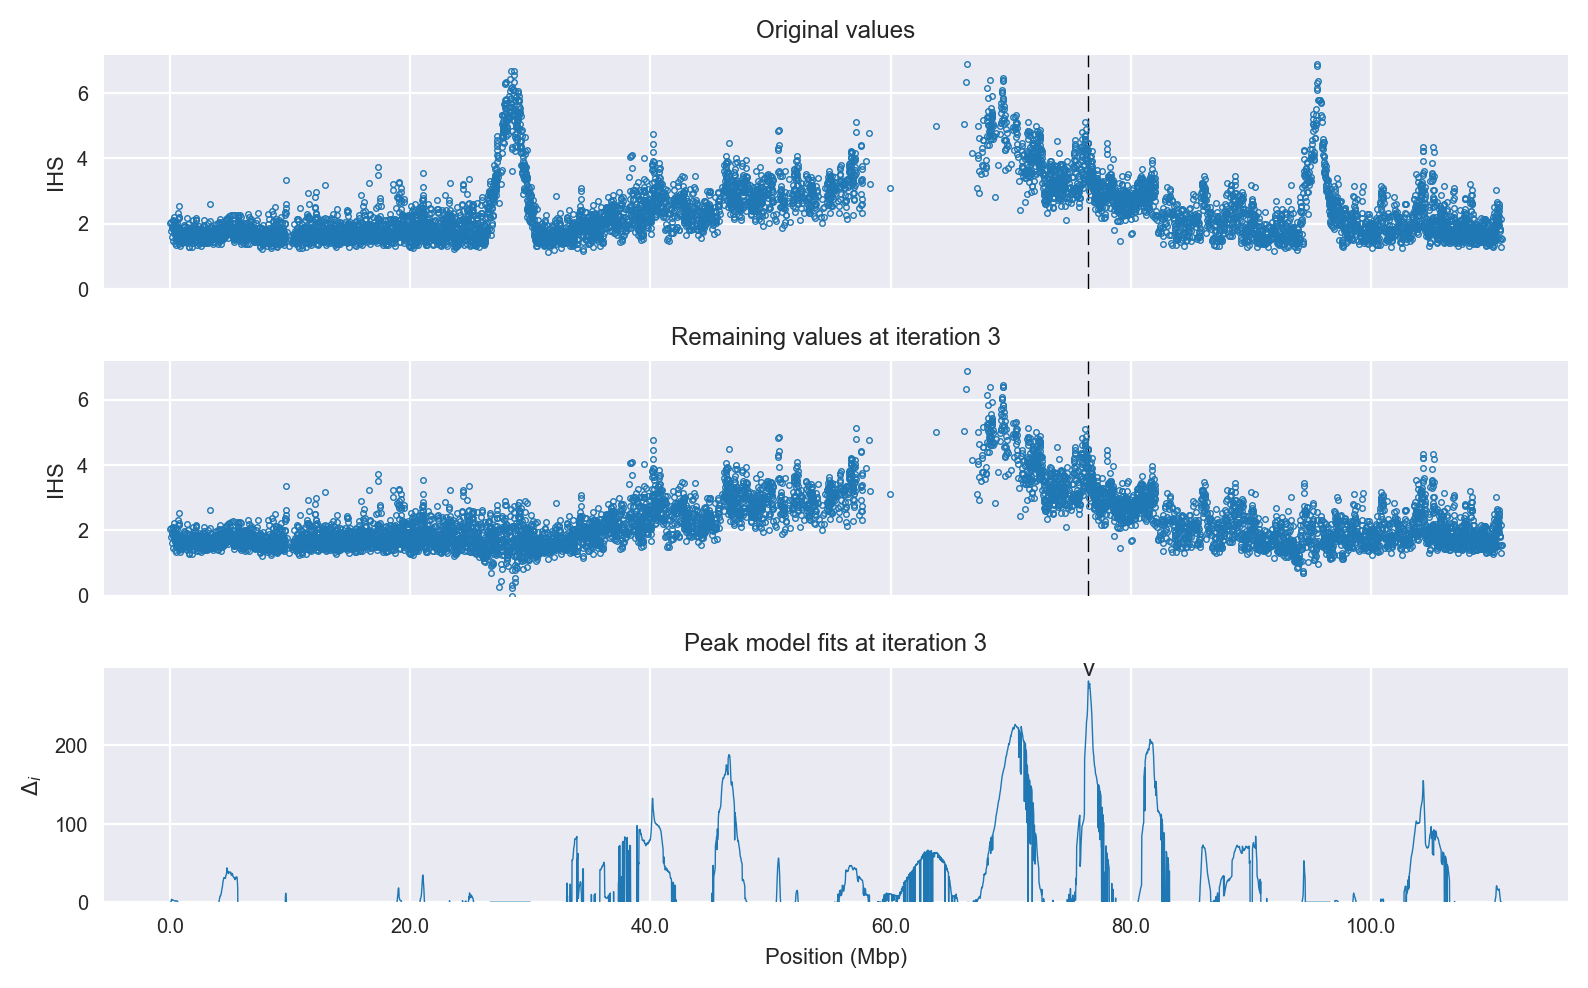
Selection signal in context. @@TODO
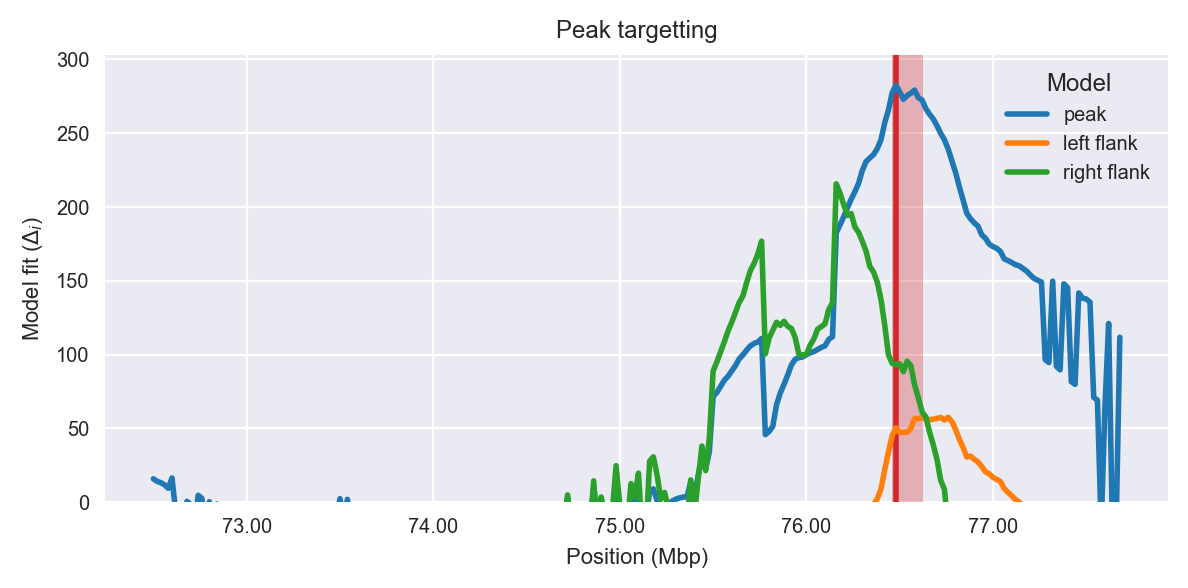
Peak targetting. @@TODO
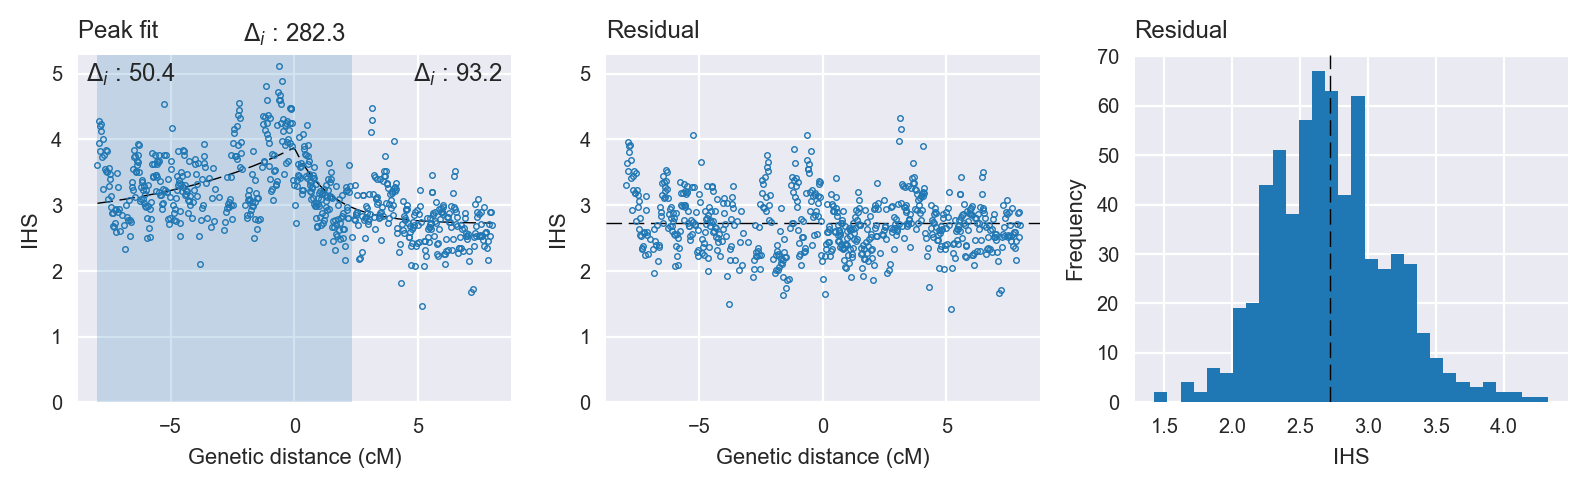
Peak fitting diagnostics. @@TODO
Model fit reports
Peak model:
[[Model]]
    Model(skewed_exponential_peak)
[[Fit Statistics]]
    # function evals   = 612
    # data points      = 644
    # variables        = 4
    chi-square         = 123.786
    reduced chi-square = 0.193
    Akaike info crit   = -1054.050
    Bayesian info crit = -1036.179
[[Variables]]
    center:      0 (fixed)
    amplitude:   1.15279595 +/- 0.062399 (5.41%) (init= 3)
    decay:       2.99979199 +/- 0.378350 (12.61%) (init= 0.5)
    skew:        0.99999999 +/- 0.086358 (8.64%) (init= 0)
    baseline:    2.72239706 +/- 0.042979 (1.58%) (init= 1)
    ceiling:     100 (fixed)
    floor:       0 (fixed)
[[Correlations]] (unreported correlations are <  0.100)
    C(decay, baseline)           = -0.754
    C(amplitude, baseline)       = -0.450
    C(skew, baseline)            = -0.295
    C(amplitude, skew)           =  0.268
    C(decay, skew)               =  0.247
Null model:
[[Model]]
    Model(constant)
[[Fit Statistics]]
    # function evals   = 12
    # data points      = 643
    # variables        = 1
    chi-square         = 193.024
    reduced chi-square = 0.301
    Akaike info crit   = -771.741
    Bayesian info crit = -767.275
[[Variables]]
    c:   3.14270448 +/- 0.021623 (0.69%) (init= 1)