IHS/UGS/2/6
This page describes a signal of selection found in the
Uganda An. gambiae populationusing the IHS (Cite et al. 20XX) statistic.The focus of this signal is on chromosome arm
2L between positions 43,554,895 and
43,674,895.
The evidence supporting this signal is
moderate ( >= 50 on both flanks).
Signal location. Blue markers show the values of the selection statistic. The dashed black line shows the fitted peak model. The shaded red area shows the focus of the selection signal. The shaded blue area shows the genomic region in linkage with the selection event. Use the mouse wheel or the controls at the top right of the plot to zoom in, and hover over genes to see gene names and descriptions.
Genes
The following 27 genes overlap the focal region: AGAP007138 (Wurst), AGAP007139 (Ser/Thr protein phosphatase/nucleotidase), AGAP007140 (Ser/Thr protein phosphatase/nucleotidase), AGAP007141 (Serine-type enodpeptidase), AGAP007142 (Serine-type enodpeptidase), AGAP007143, AGAP007144, AGAP007145, AGAP007146, AGAP007147 (exosome complex protein LRP1), AGAP007148, AGAP007149, AGAP007150, AGAP007151, AGAP007152, AGAP007153, AGAP007154, AGAP007155, AGAP007156, AGAP007157 (RpS27 - 40S ribosomal protein S27), AGAP007158 (alpha-crystallin B chain), AGAP007159 (alpha-crystallin B chain), AGAP007160 (alpha-crystallin chain B), AGAP007161 (alpha-crystallin chain A), AGAP007162 (alpha-crystallin chain A), AGAP007163 (3’,5’-cyclic-nucleotide phosphodiesterase), AGAP007164.
Gene AGAP007137 is within 50 kbp of the focal region.
Key to insecticide resistance candidate gene types: 1 metabolic; 2 target-site; 3 behavioural; 4 cuticular.
Diagnostics
The information below provides some diagnostics from the Peak modelling algorithm.
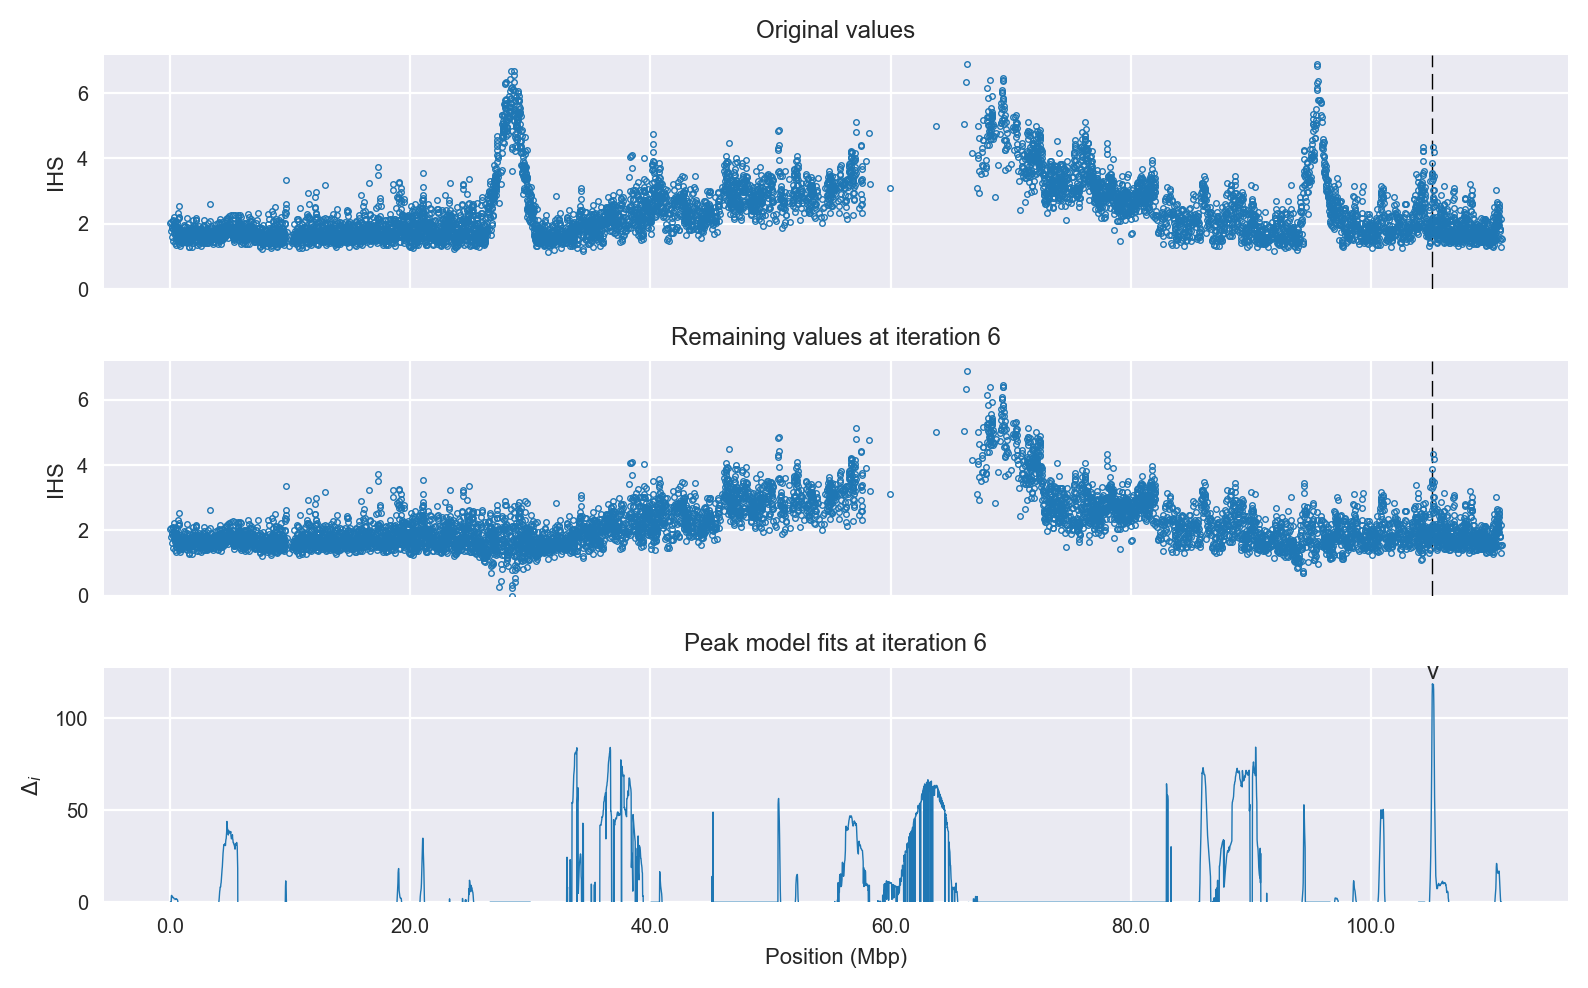
Selection signal in context. @@TODO
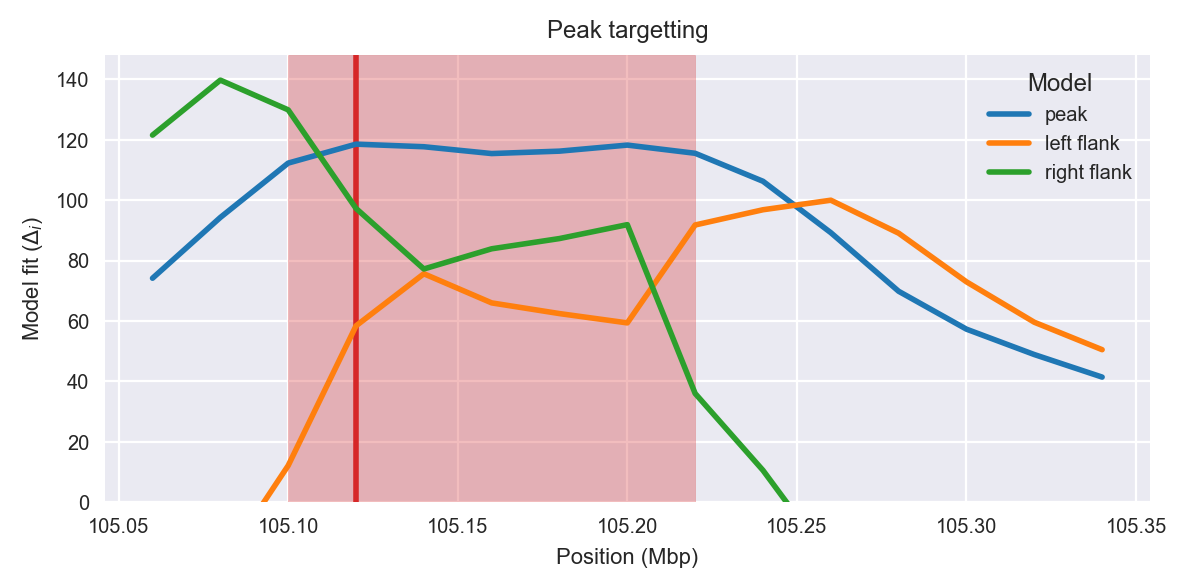
Peak targetting. @@TODO
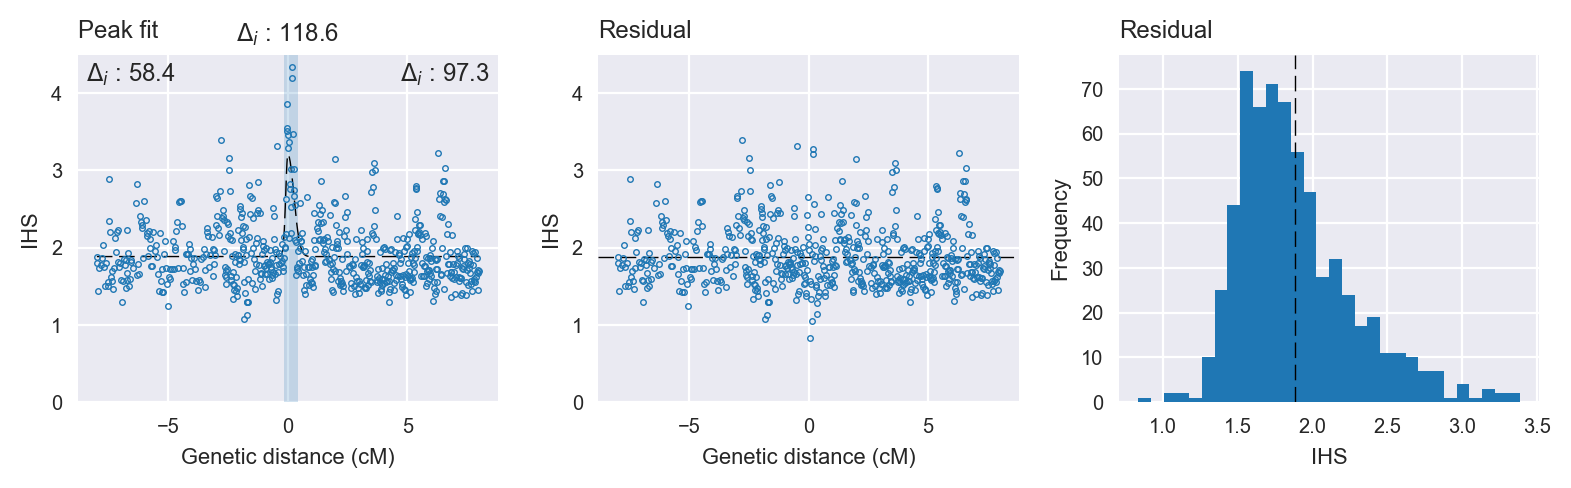
Peak fitting diagnostics. @@TODO
Model fit reports
Peak model:
[[Model]]
    Model(skewed_gaussian)
[[Fit Statistics]]
    # function evals   = 56
    # data points      = 645
    # variables        = 4
    chi-square         = 97.046
    reduced chi-square = 0.151
    Akaike info crit   = -1213.674
    Bayesian info crit = -1195.797
[[Variables]]
    center:      0 (fixed)
    amplitude:   1.32361556 +/- 0.121481 (9.18%) (init= 3)
    sigma:       0.15000023 +/- 0.017519 (11.68%) (init= 0.5)
    skew:       -0.72177138 +/- 0.140558 (19.47%) (init= 0)
    baseline:    1.88447134 +/- 0.015867 (0.84%) (init= 1)
    ceiling:     100 (fixed)
    floor:       0 (fixed)
[[Correlations]] (unreported correlations are <  0.100)
    C(amplitude, sigma)          = -0.518
    C(sigma, skew)               =  0.352
    C(sigma, baseline)           = -0.137
Null model:
[[Model]]
    Model(constant)
[[Fit Statistics]]
    # function evals   = 11
    # data points      = 644
    # variables        = 1
    chi-square         = 117.228
    reduced chi-square = 0.182
    Akaike info crit   = -1095.104
    Bayesian info crit = -1090.636
[[Variables]]
    c:   1.92533379 +/- 0.016825 (0.87%) (init= 1)