XPEHH/AOM.BFM/2/7
This page describes a signal of selection found in the
Angola An. coluzzii population
when compared with the Burkina Faso An. coluzzii population
using the XPEHH (Cite et al. 20XX) statistic.The focus of this signal is on chromosome arm
2R between positions 34,320,000 and
34,440,000.
The evidence supporting this signal is
moderate ( >= 50 on both flanks).
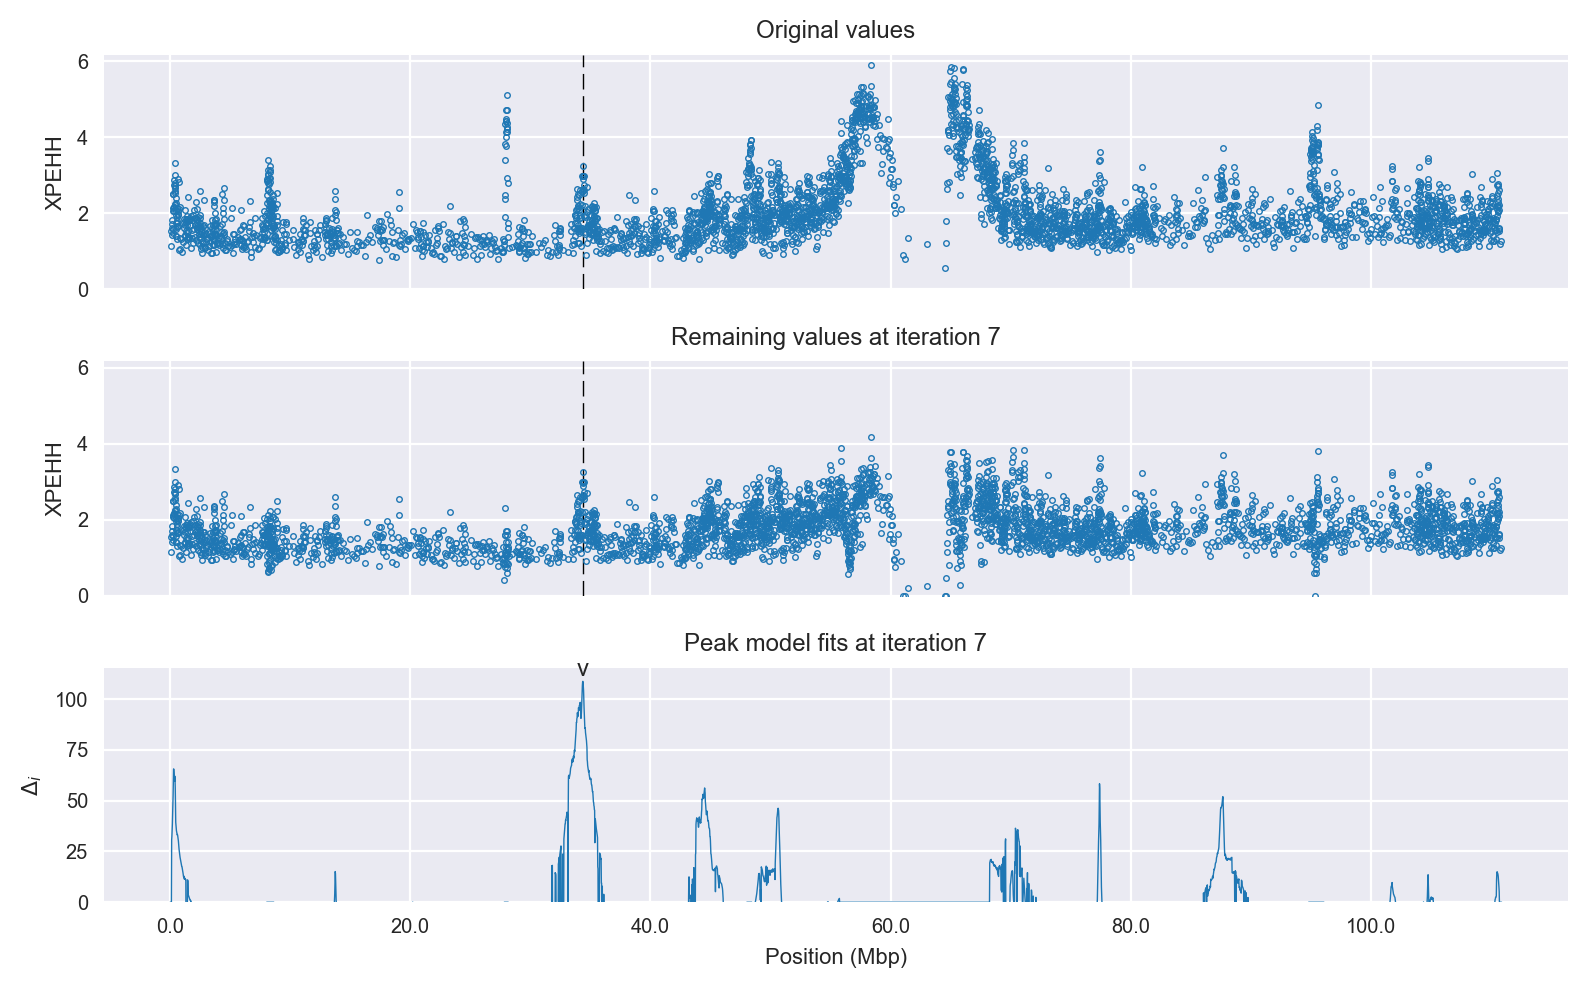
Signal location. Blue markers show the values of the selection statistic. The dashed black line shows the fitted peak model. The shaded red area shows the focus of the selection signal. The shaded blue area shows the genomic region in linkage with the selection event. Use the mouse wheel or the controls at the top right of the plot to zoom in, and hover over genes to see gene names and descriptions.
Genes
The following 7 genes overlap the focal region: AGAP003238 (N-myc downstream regulated), AGAP003239 (meiotic chromosome segregation protein), AGAP003240 (Protein jagunal), AGAP003241, AGAP003242 (RNA polymerase-associated protein LEO1), AGAP003243, AGAP003244 (GPRGHP2 - putative growth hormone releasing hormone receptor 2).
The following 15 genes are within 50 kbp of the focal region: AGAP003235 (lachesin), AGAP003236, AGAP003237 (tubulin, alpha 1), AGAP003245 (CLIPA19 - CLIP-domain serine protease), AGAP003246 (CLIPB2 - CLIP-domain serine protease), AGAP003247 (CLIPB19 - CLIP-domain serine protease), AGAP003248, AGAP013487, AGAP003249 (CLIPB3 - CLIP-domain serine protease), AGAP003250 (CLIPB4 - CLIP-domain serine protease), AGAP003251 (CLIPB1 - CLIP-domain serine protease), AGAP003252 (CLIPB6 - CLIP-domain serine protease), AGAP013184 (CLIPB36 - CLIP-domain serine protease), AGAP003253 (Gr15 - gustatory receptor 15), AGAP003254 (Gr16 - gustatory receptor 16).
Key to insecticide resistance candidate gene types: 1 metabolic; 2 target-site; 3 behavioural; 4 cuticular.
Overlapping selection signals
The following selection signals have a focus which overlaps with the focus of this signal.
| Signal | Statistic | Population | Focus | Peak model |
Max. percentile | Known locus |
|---|---|---|---|---|---|---|
| IHS/AOM/2/3 | IHS | Angola An. coluzzii | 2R:33,940,000-34,440,000 | 213 | 99.8% | nan |
| H12/BFS/2/6 | H12 | Burkina Faso An. gambiae | 2R:34,420,000-34,460,000 | 114 | 92.9% | nan |
| XPEHH/BFS.UGS/2/5 | XPEHH | Burkina Faso An. gambiae | 2R:34,420,000-34,480,000 | 95 | 96.7% | nan |
Diagnostics
The information below provides some diagnostics from the Peak modelling algorithm.
Selection signal in context. @@TODO
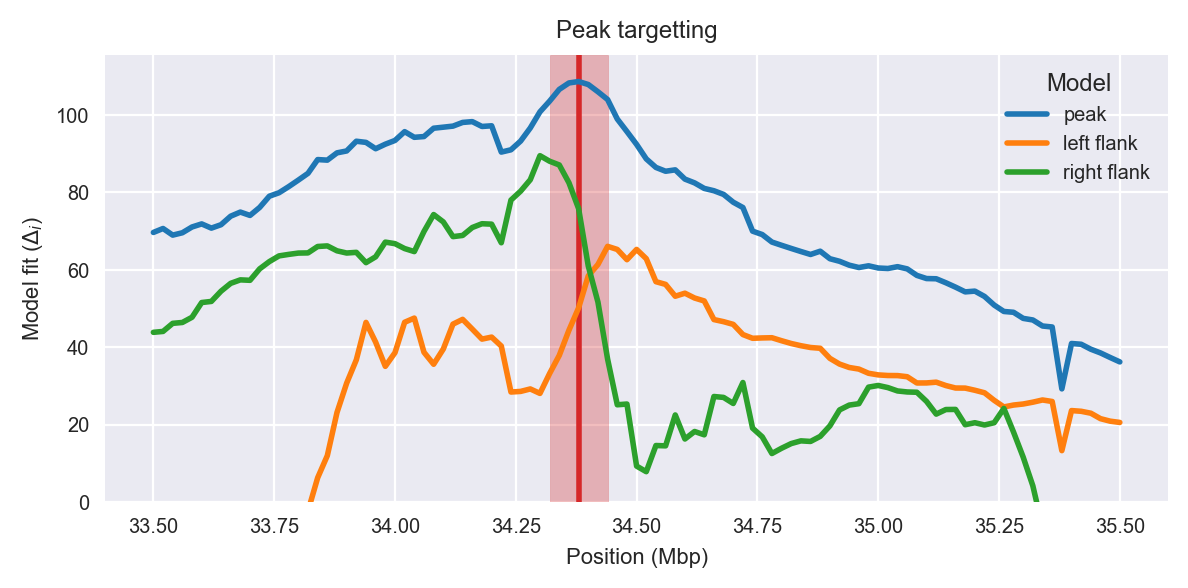
Peak targetting. @@TODO
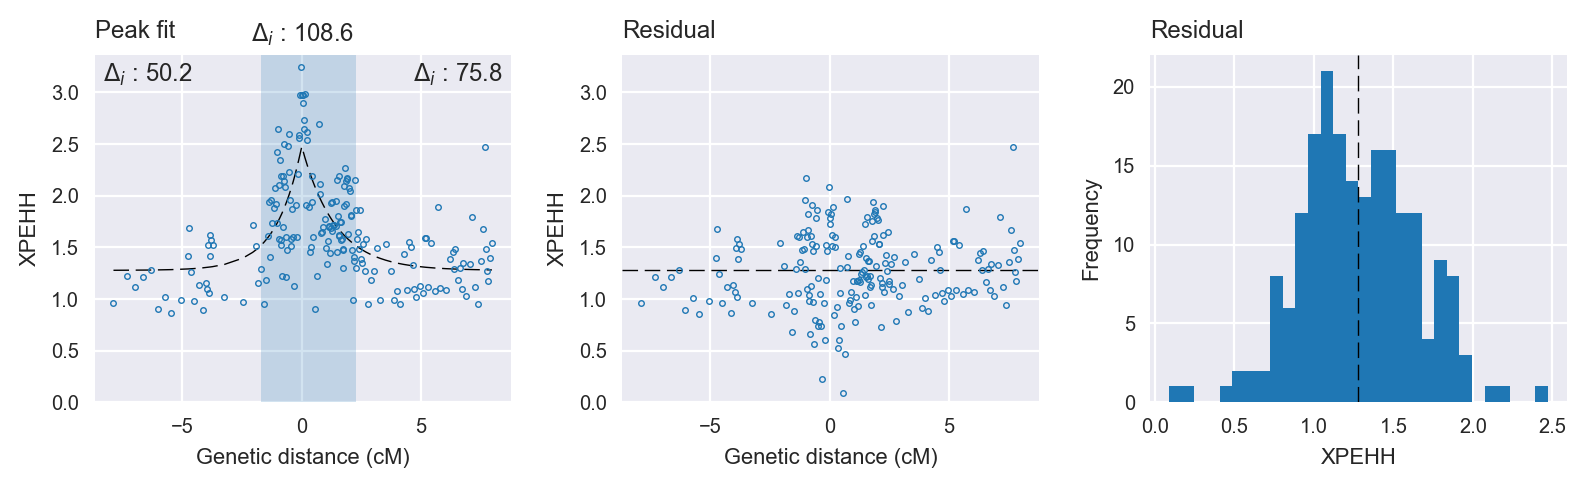
Peak fitting diagnostics. @@TODO
Model fit reports
Peak model:
[[Model]]
    Model(skewed_exponential_peak)
[[Fit Statistics]]
    # function evals   = 48
    # data points      = 200
    # variables        = 4
    chi-square         = 26.430
    reduced chi-square = 0.135
    Akaike info crit   = -396.767
    Bayesian info crit = -383.574
[[Variables]]
    center:      0 (fixed)
    amplitude:   1.20160860 +/- 0.098444 (8.19%) (init= 3)
    decay:       1.22234704 +/- 0.211579 (17.31%) (init= 0.5)
    skew:       -0.20135756 +/- 0.126282 (62.72%) (init= 0)
    baseline:    1.27689787 +/- 0.052930 (4.15%) (init= 1)
    ceiling:     100 (fixed)
    floor:       0 (fixed)
[[Correlations]] (unreported correlations are <  0.100)
    C(decay, baseline)           = -0.674
    C(amplitude, decay)          = -0.318
    C(amplitude, baseline)       = -0.298
    C(decay, skew)               =  0.170
    C(amplitude, skew)           = -0.127
Null model:
[[Model]]
    Model(constant)
[[Fit Statistics]]
    # function evals   = 11
    # data points      = 199
    # variables        = 1
    chi-square         = 46.308
    reduced chi-square = 0.234
    Akaike info crit   = -288.141
    Bayesian info crit = -284.847
[[Variables]]
    c:   1.63012689 +/- 0.034282 (2.10%) (init= 1)