XPEHH/AOM.GAS/2/1
This page describes a signal of selection found in the
Angola An. coluzzii population
when compared with the Gabon An. gambiae population
using the XPEHH (Cite et al. 20XX) statistic.The focus of this signal is on chromosome arm
2R between positions 34,680,000 and
34,820,000.
The evidence supporting this signal is
weak ( < 50 on one or both flanks).
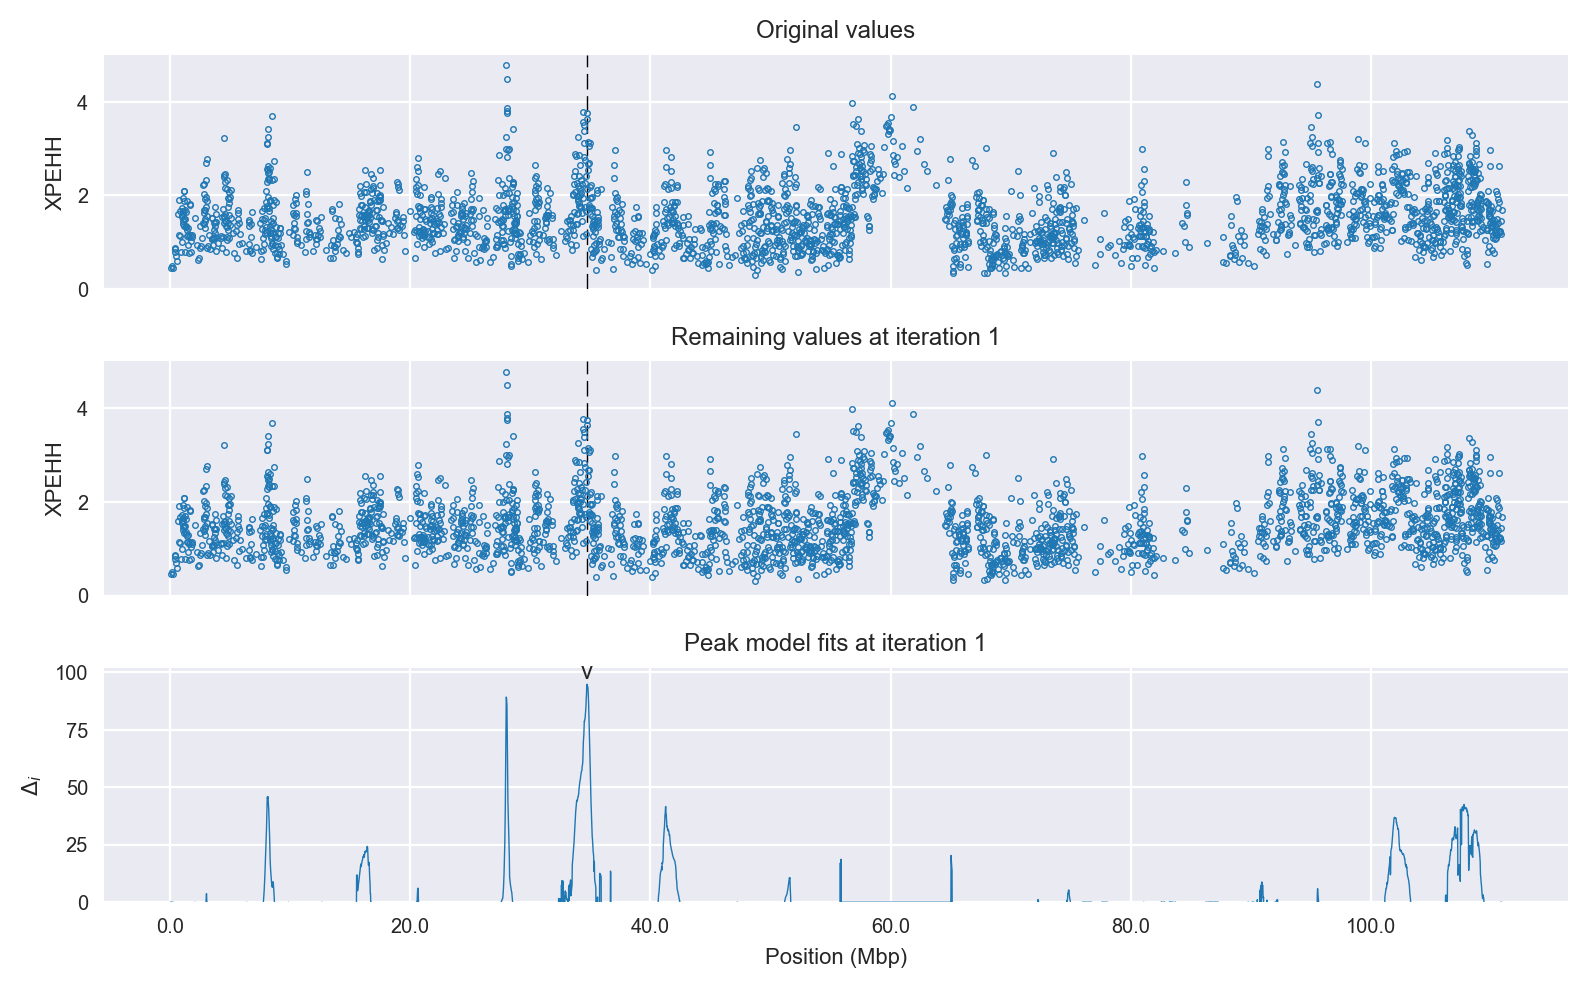
Signal location. Blue markers show the values of the selection statistic. The dashed black line shows the fitted peak model. The shaded red area shows the focus of the selection signal. The shaded blue area shows the genomic region in linkage with the selection event. Use the mouse wheel or the controls at the top right of the plot to zoom in, and hover over genes to see gene names and descriptions.
Genes
The following 13 genes overlap the focal region: AGAP003268 (sex comb on midleg-like protein 2), AGAP003269 (DH44 - diueretic hormone 44), AGAP003271 (dynein, axonemal, heavy chain 5), AGAP003272, AGAP003273, AGAP003274 (solute carrier family 12 (sodium/potassium/chloride transporter), member 2), AGAP003275 (solute carrier family 12 (sodium/potassium/chloride transporter), member 2), AGAP003276 (splicing factor, arginine/serine-rich 17), AGAP003277 (cathepsin D), AGAP003278 (7SK snRNA methylphosphate capping enzyme), AGAP003279 (superkiller protein 3), AGAP003280, AGAP003281.
The following 3 genes are within 50 kbp of the focal region: AGAP003267, AGAP013539, AGAP003282 (Histone-lysine N-methyltransferase, H3 lysine-79 specific).
Key to insecticide resistance candidate gene types: 1 metabolic; 2 target-site; 3 behavioural; 4 cuticular.
Diagnostics
The information below provides some diagnostics from the Peak modelling algorithm.
Selection signal in context. @@TODO
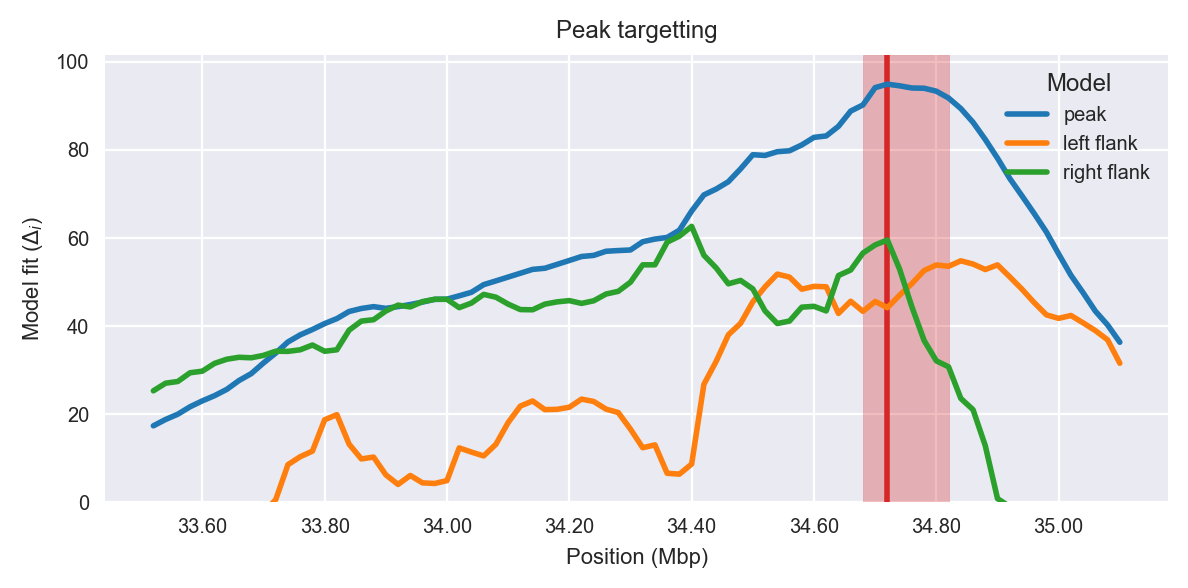
Peak targetting. @@TODO
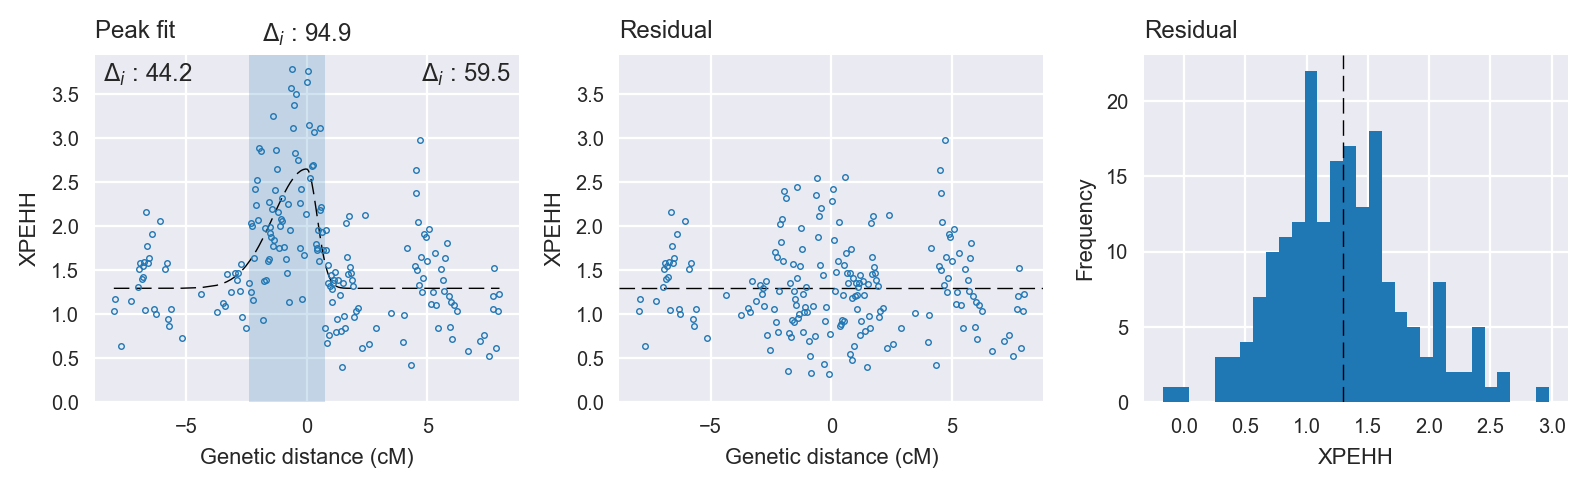
Peak fitting diagnostics. @@TODO
Model fit reports
Peak model:
[[Model]]
    Model(skewed_gaussian)
[[Fit Statistics]]
    # function evals   = 43
    # data points      = 193
    # variables        = 4
    chi-square         = 53.549
    reduced chi-square = 0.283
    Akaike info crit   = -239.445
    Bayesian info crit = -226.395
[[Variables]]
    center:      0 (fixed)
    amplitude:   1.35643722 +/- 0.123692 (9.12%) (init= 3)
    sigma:       0.76993931 +/- 0.087879 (11.41%) (init= 0.5)
    skew:        0.83410541 +/- 0.121964 (14.62%) (init= 0)
    baseline:    1.29458335 +/- 0.052902 (4.09%) (init= 1)
    ceiling:     100 (fixed)
    floor:       0 (fixed)
[[Correlations]] (unreported correlations are <  0.100)
    C(sigma, baseline)           = -0.425
    C(amplitude, sigma)          = -0.352
    C(amplitude, baseline)       = -0.333
    C(sigma, skew)               = -0.270
Null model:
[[Model]]
    Model(constant)
[[Fit Statistics]]
    # function evals   = 11
    # data points      = 192
    # variables        = 1
    chi-square         = 89.490
    reduced chi-square = 0.469
    Akaike info crit   = -144.567
    Bayesian info crit = -141.309
[[Variables]]
    c:   1.62480176 +/- 0.049399 (3.04%) (init= 1)