XPEHH/BFS.GWA/2/4
This page describes a signal of selection found in the
Burkina Faso An. gambiae population
when compared with the Guinea Bissau population
using the XPEHH (Cite et al. 20XX) statistic.The focus of this signal is on chromosome arm
2L between positions 4,914,895 and
5,234,895.
The evidence supporting this signal is
weak ( < 50 on one or both flanks).
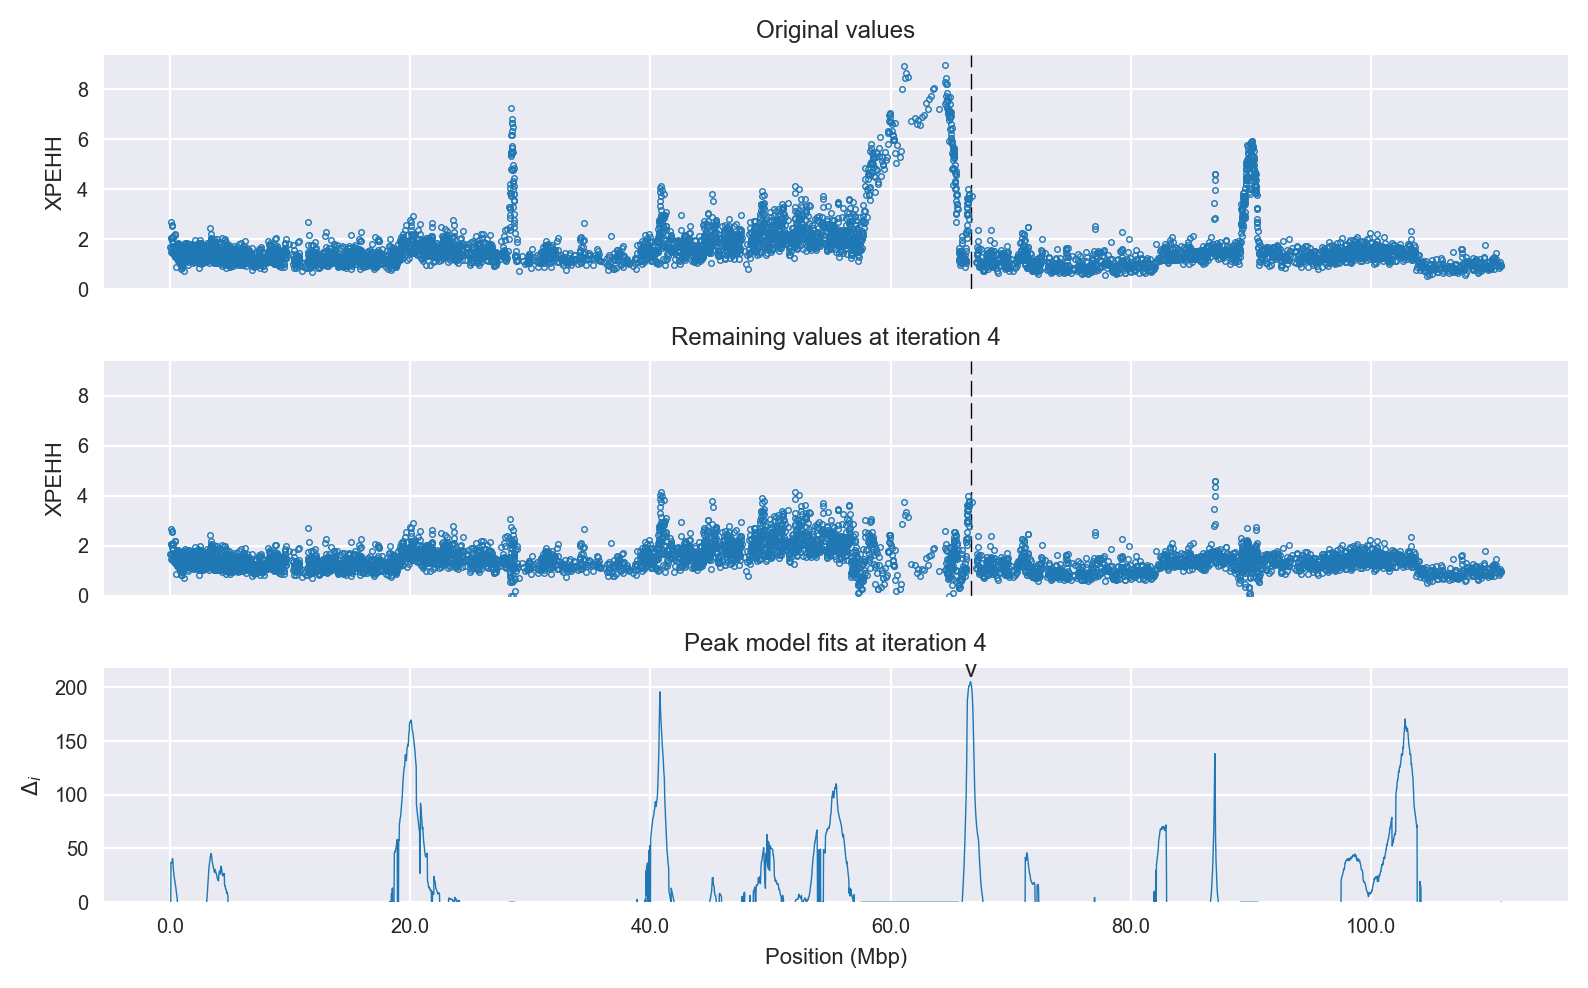
Signal location. Blue markers show the values of the selection statistic. The dashed black line shows the fitted peak model. The shaded red area shows the focus of the selection signal. The shaded blue area shows the genomic region in linkage with the selection event. Use the mouse wheel or the controls at the top right of the plot to zoom in, and hover over genes to see gene names and descriptions.
Genes
The following 13 genes overlap the focal region: AGAP004881 (bestrophin 2,3,4), AGAP004882 (transmembrane 9 superfamily member 3), AGAP004883, AGAP004884 (muskelin), AGAP004885 (CDGSH iron sulfur domain-containing protein 3, mitochondrial), AGAP004886 (microtubule-associated protein, RP/EB family), AGAP004887 (RpS17 - 40S ribosomal protein S17), AGAP004888, AGAP004889 (ubiquitin-conjugating enzyme (huntingtin interacting protein 2)), AGAP004890 (ribose-phosphate pyrophosphokinase), AGAP004891 (metallophosphoesterase domain-containing protein 1), AGAP004892, AGAP004893.
The following 4 genes are within 50 kbp of the focal region: AGAP004877 (paramyosin), AGAP004878, AGAP004879, AGAP0048801 (L-lactate dehydrogenase).
Key to insecticide resistance candidate gene types: 1 metabolic; 2 target-site; 3 behavioural; 4 cuticular.
Diagnostics
The information below provides some diagnostics from the Peak modelling algorithm.
Selection signal in context. @@TODO
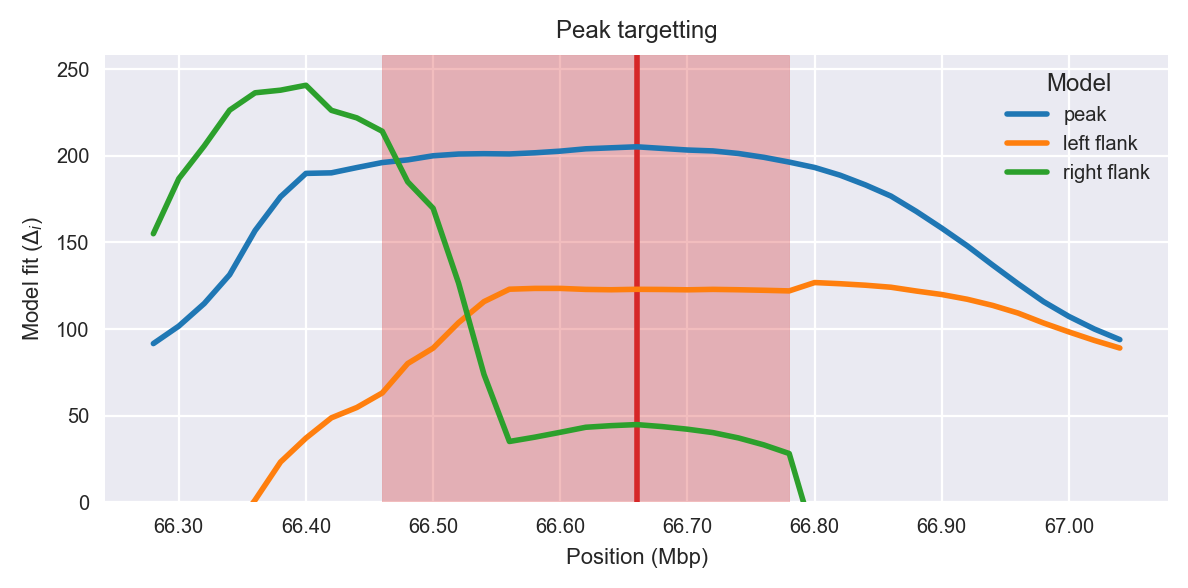
Peak targetting. @@TODO
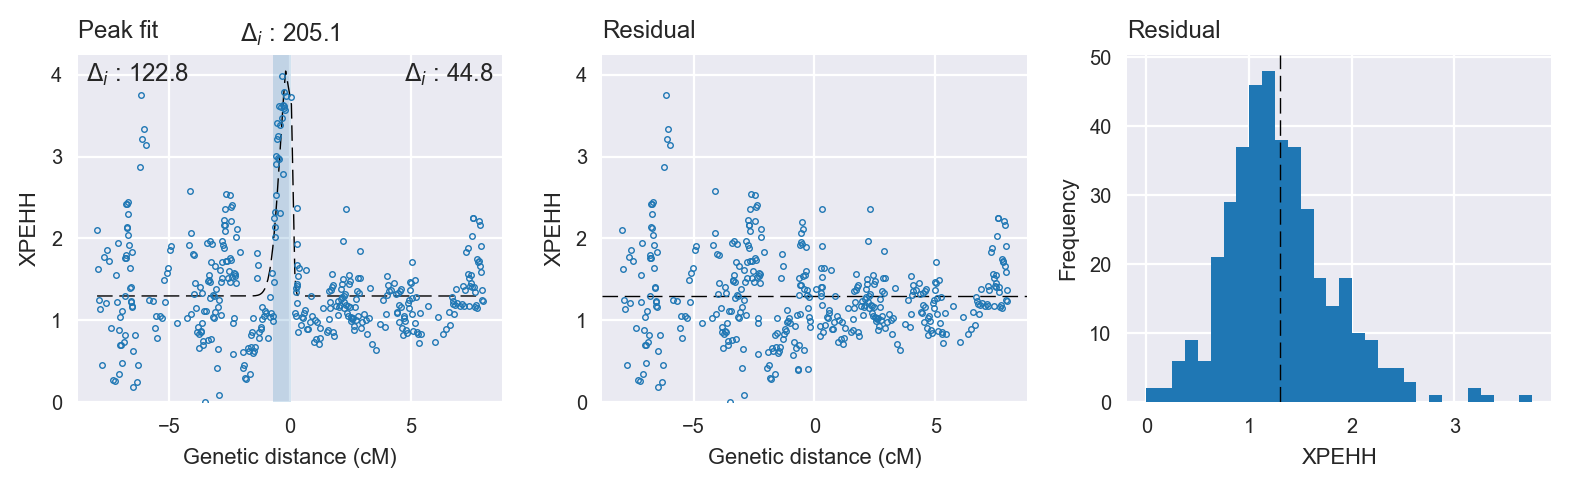
Peak fitting diagnostics. @@TODO
Model fit reports
Peak model:
[[Model]]
    Model(skewed_gaussian)
[[Fit Statistics]]
    # function evals   = 51
    # data points      = 396
    # variables        = 4
    chi-square         = 108.907
    reduced chi-square = 0.278
    Akaike info crit   = -503.203
    Bayesian info crit = -487.277
[[Variables]]
    center:      0 (fixed)
    amplitude:   3.01873174 +/- 0.255258 (8.46%) (init= 3)
    sigma:       0.19401453 +/- 0.027029 (13.93%) (init= 0.5)
    skew:        0.99999999 +/- 0.007152 (0.72%) (init= 0)
    baseline:    1.29755356 +/- 0.028026 (2.16%) (init= 1)
    ceiling:     100 (fixed)
    floor:       0 (fixed)
[[Correlations]] (unreported correlations are <  0.100)
    C(sigma, skew)               = -0.836
    C(amplitude, sigma)          = -0.412
    C(sigma, baseline)           = -0.168
Null model:
[[Model]]
    Model(constant)
[[Fit Statistics]]
    # function evals   = 10
    # data points      = 395
    # variables        = 1
    chi-square         = 184.754
    reduced chi-square = 0.469
    Akaike info crit   = -298.146
    Bayesian info crit = -294.167
[[Variables]]
    c:   1.41568953 +/- 0.034454 (2.43%) (init= 1)