XPEHH/BFS.GWA/3/2
This page describes a signal of selection found in the
Burkina Faso An. gambiae population
when compared with the Guinea Bissau population
using the XPEHH (Cite et al. 20XX) statistic.The focus of this signal is on chromosome arm
3L between positions 10,219,316 and
10,379,316.
The evidence supporting this signal is
weak ( < 50 on one or both flanks).
Signal location. Blue markers show the values of the selection statistic. The dashed black line shows the fitted peak model. The shaded red area shows the focus of the selection signal. The shaded blue area shows the genomic region in linkage with the selection event. Use the mouse wheel or the controls at the top right of the plot to zoom in, and hover over genes to see gene names and descriptions.
Genes
The following 11 genes overlap the focal region: AGAP010778, AGAP010779, AGAP010780, AGAP010781, AGAP010782 (Ral guanine nucleotide exchange factor 2), AGAP010783, AGAP010784 (dolichyl-phosphate-mannose-protein mannosyltransferase), AGAP010785 (fatty acyl CoA reductase 2), AGAP010786, AGAP010787 (timeless), AGAP010788 (fatty acyl-CoA reductase 1).
The following 7 genes are within 50 kbp of the focal region: AGAP010776, AGAP010777 (hunchback), AGAP010789, AGAP010790 (dynein heavy chain 2, cytosolic), AGAP010791 (polyribonucleotide nucleotidyltransferase), AGAP010792 (NADH dehydrogenase (ubiquinone) 1 alpha subcomplex 9), AGAP010793 (synembryn-A).
Key to insecticide resistance candidate gene types: 1 metabolic; 2 target-site; 3 behavioural; 4 cuticular.
Diagnostics
The information below provides some diagnostics from the Peak modelling algorithm.
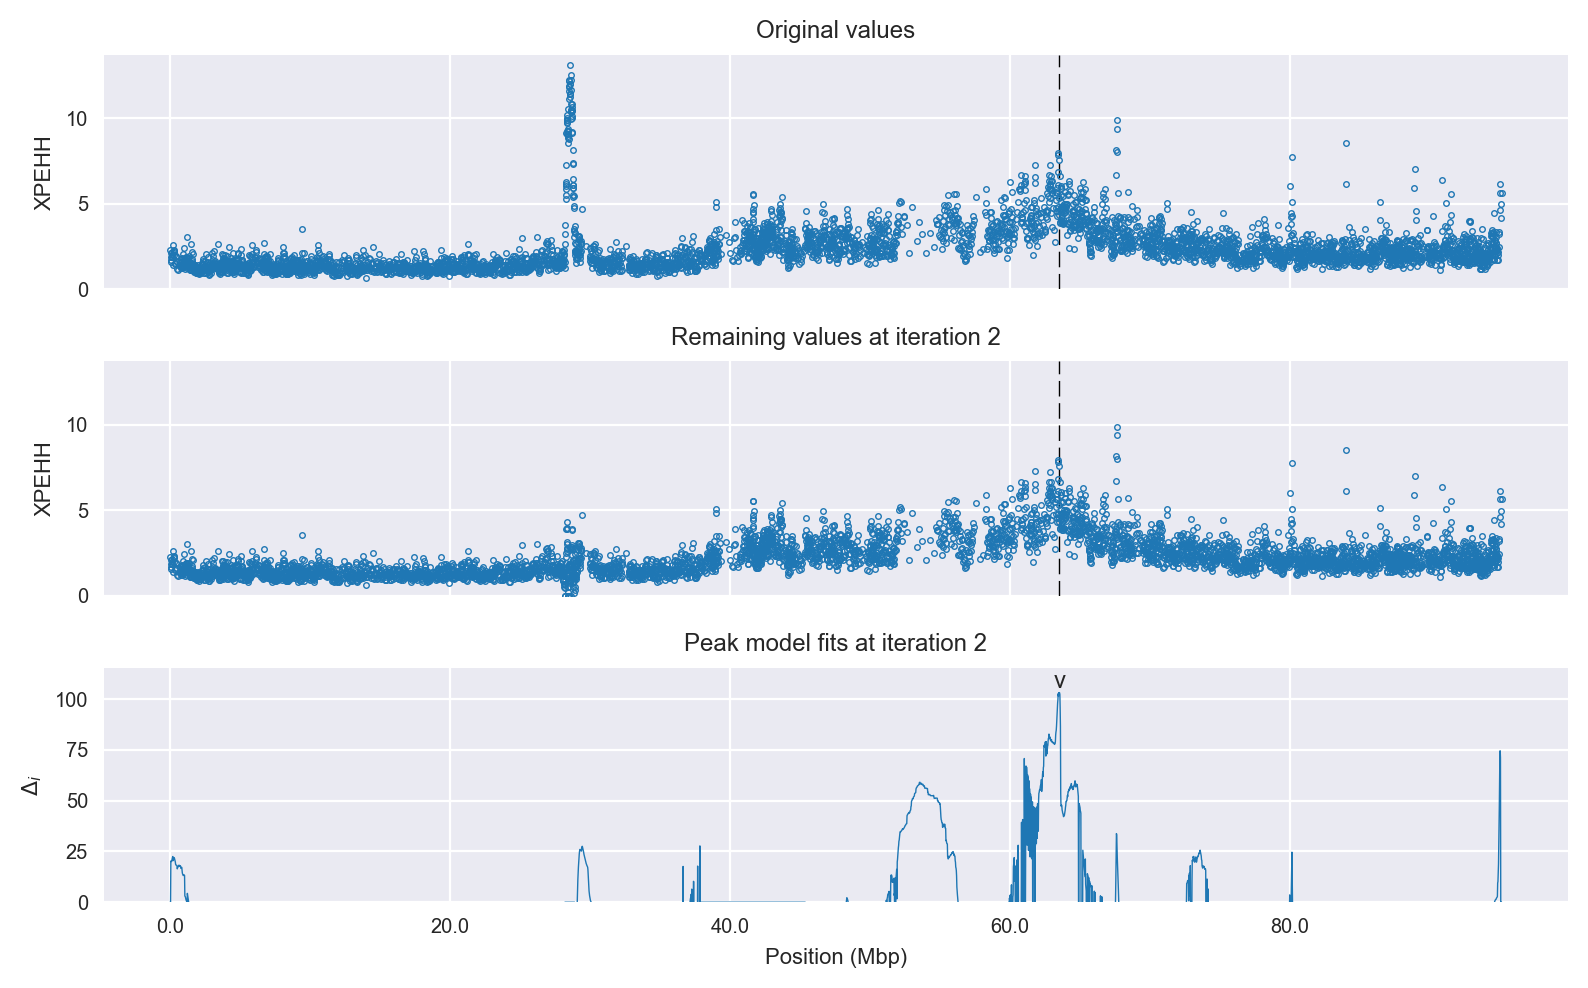
Selection signal in context. @@TODO
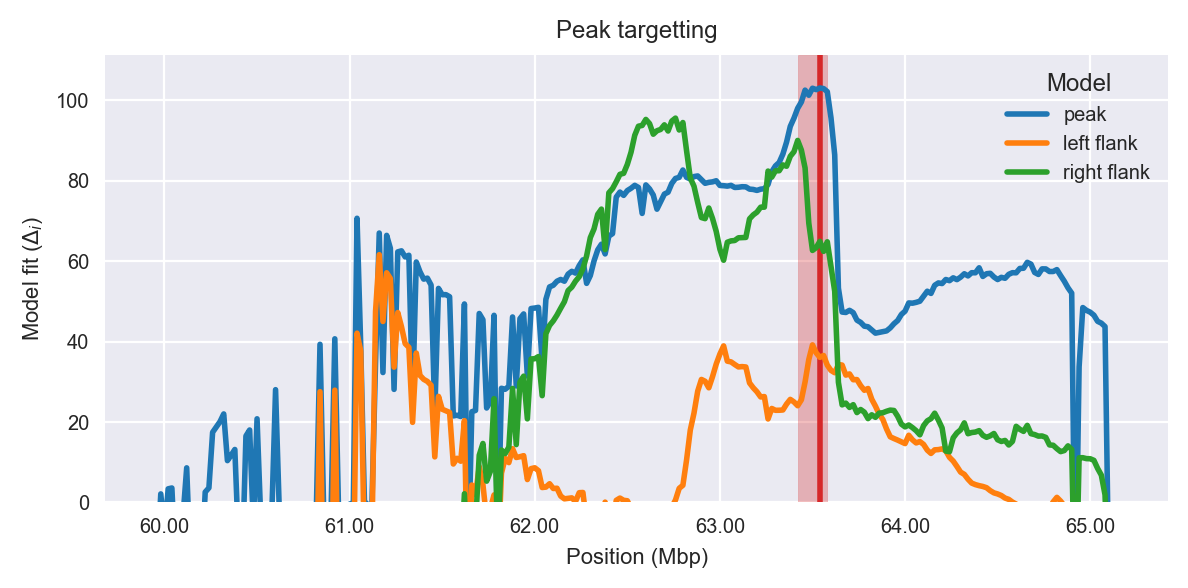
Peak targetting. @@TODO
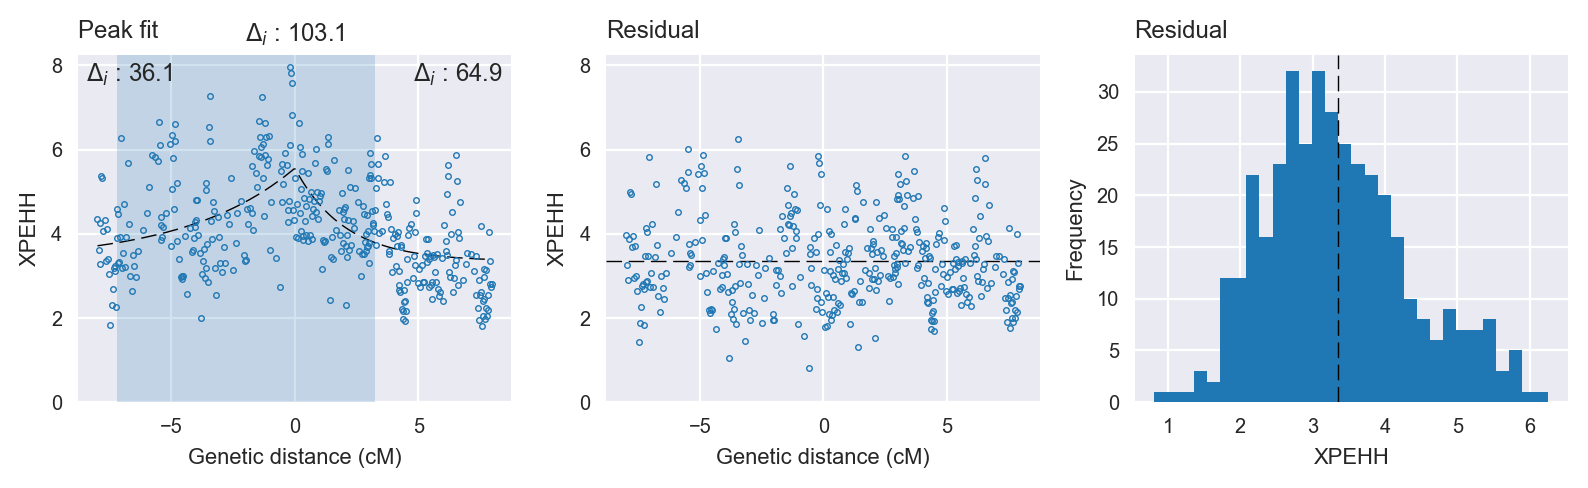
Peak fitting diagnostics. @@TODO
Model fit reports
Peak model:
[[Model]]
    Model(skewed_exponential_peak)
[[Fit Statistics]]
    # function evals   = 49
    # data points      = 381
    # variables        = 4
    chi-square         = 388.206
    reduced chi-square = 1.030
    Akaike info crit   = 15.139
    Bayesian info crit = 30.910
[[Variables]]
    center:      0 (fixed)
    amplitude:   2.21037256 +/- 0.194148 (8.78%) (init= 3)
    decay:       2.99999999 +/- 0.073092 (2.44%) (init= 0.5)
    skew:        0.57144202 +/- 0.130364 (22.81%) (init= 0)
    baseline:    3.34811371 +/- 0.166796 (4.98%) (init= 1)
    ceiling:     100 (fixed)
    floor:       0 (fixed)
[[Correlations]] (unreported correlations are <  0.100)
    C(decay, baseline)           =  0.860
    C(amplitude, baseline)       = -0.512
    C(skew, baseline)            =  0.305
    C(decay, skew)               =  0.243
    C(amplitude, skew)           = -0.241
    C(amplitude, decay)          = -0.129
Null model:
[[Model]]
    Model(constant)
[[Fit Statistics]]
    # function evals   = 13
    # data points      = 380
    # variables        = 1
    chi-square         = 515.978
    reduced chi-square = 1.361
    Akaike info crit   = 118.239
    Bayesian info crit = 122.179
[[Variables]]
    c:   4.10677566 +/- 0.059855 (1.46%) (init= 1)