XPEHH/CMS.GAS/2/4
This page describes a signal of selection found in the
Cameroon An. gambiae population
when compared with the Gabon An. gambiae population
using the XPEHH (Cite et al. 20XX) statistic.The focus of this signal is on chromosome arm
2R between positions 15,980,000 and
16,140,000.
The evidence supporting this signal is
weak ( < 50 on one or both flanks).
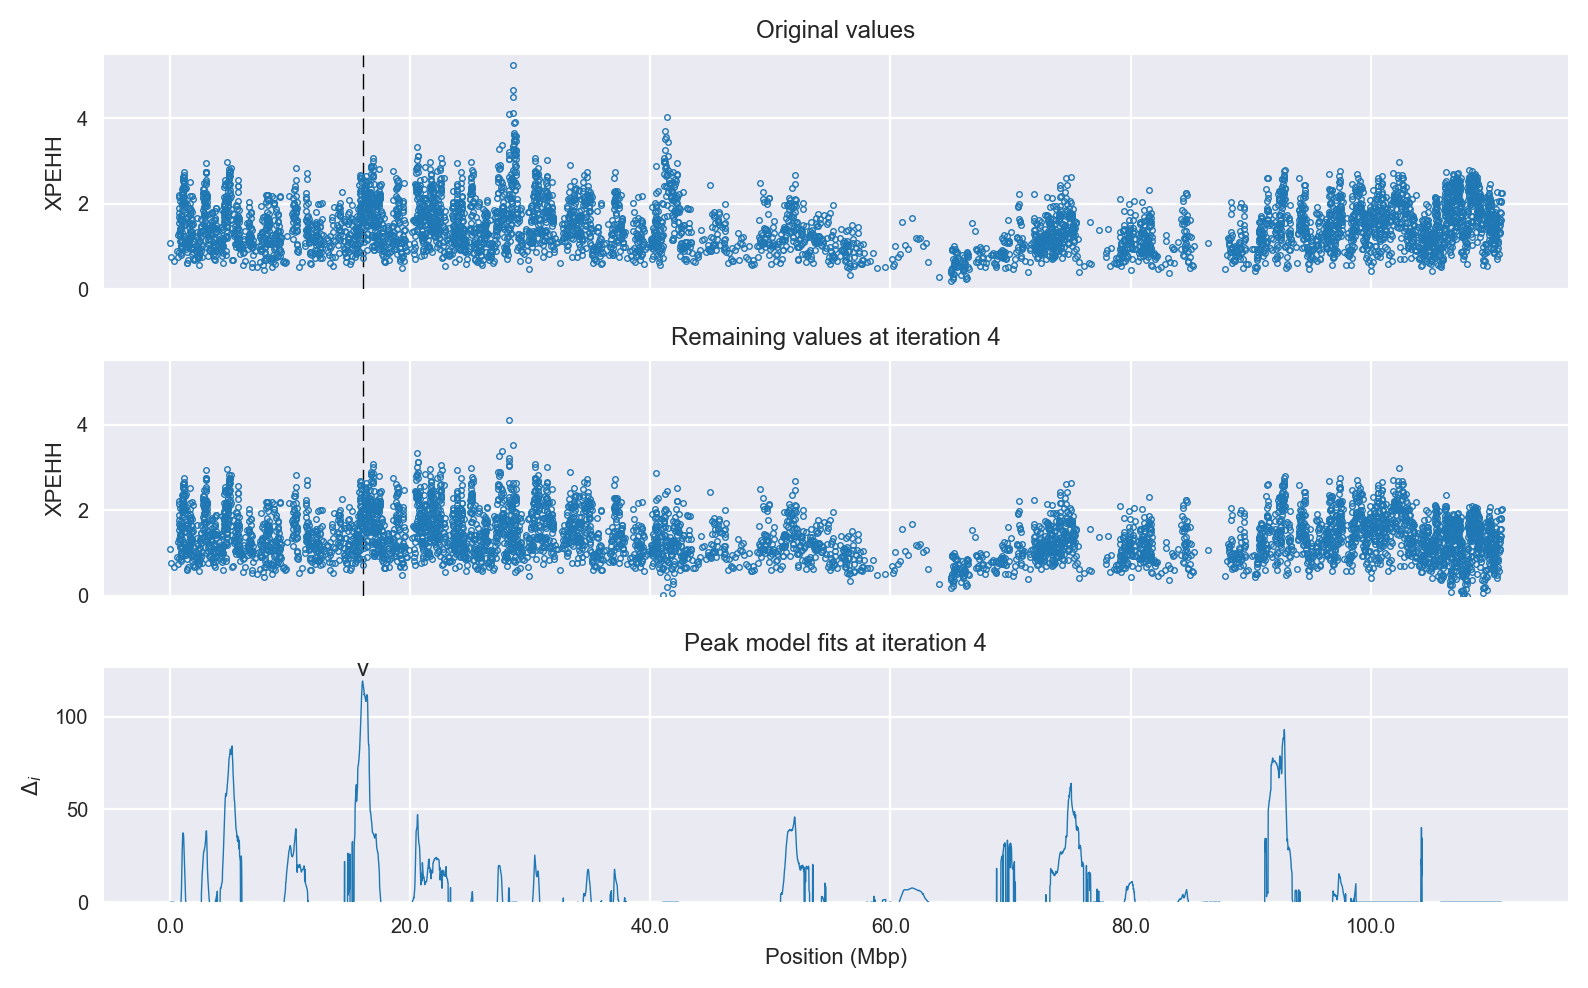
Signal location. Blue markers show the values of the selection statistic. The dashed black line shows the fitted peak model. The shaded red area shows the focus of the selection signal. The shaded blue area shows the genomic region in linkage with the selection event. Use the mouse wheel or the controls at the top right of the plot to zoom in, and hover over genes to see gene names and descriptions.
Genes
The following 16 genes overlap the focal region: AGAP002118 (zinc finger protein 622), AGAP002119 (dual-specificity tyrosine-(Y)-phosphorylation regulated kinase), AGAP002120 (RUN and TBC1 domain-containing protein 3), AGAP002121 (DNA-directed RNA polymerase II subunit RPB7), AGAP002122 (RpL32 - 60S ribosomal protein L32), AGAP002123 (Axn - axin), AGAP002124, AGAP0021253 (Or34 - odorant receptor 34), AGAP0021263 (Or37 - odorant receptor 37), AGAP002127 (alpha-centractin), AGAP002128 (BRCA1-associated protein), AGAP002129 (deoxyhypusine monooxygenase), AGAP002130 (tubulin-specific chaperone A), AGAP002131, AGAP002132 (YEATS domain-containing protein 1/3), AGAP002133 (tRNA modification GTPase).
Gene AGAP002117 is within 50 kbp of the focal region.
Key to insecticide resistance candidate gene types: 1 metabolic; 2 target-site; 3 behavioural; 4 cuticular.
Diagnostics
The information below provides some diagnostics from the Peak modelling algorithm.
Selection signal in context. @@TODO
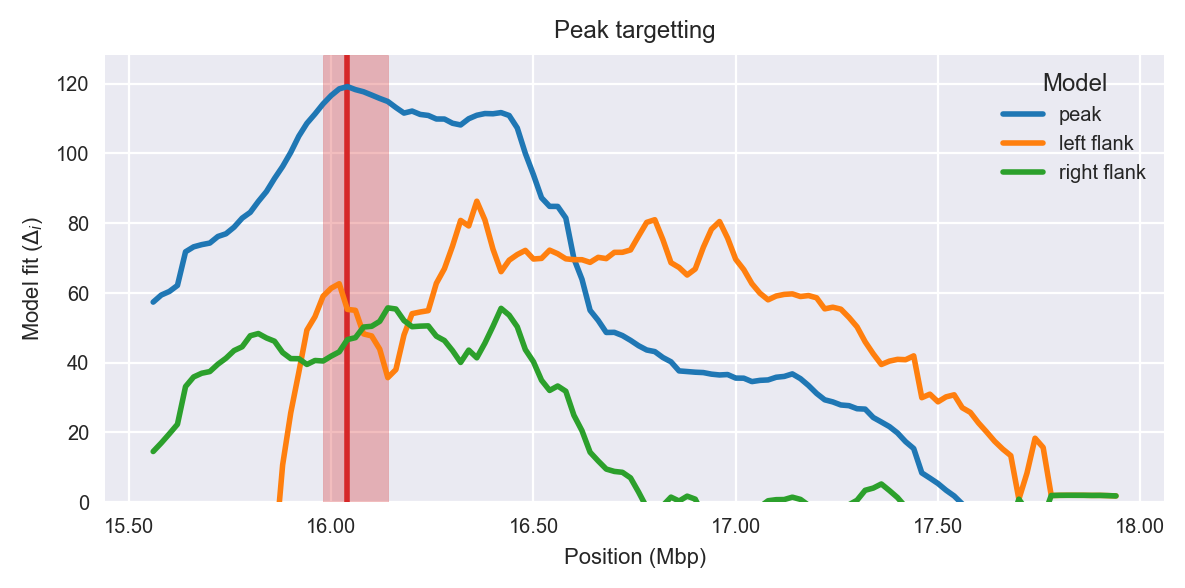
Peak targetting. @@TODO
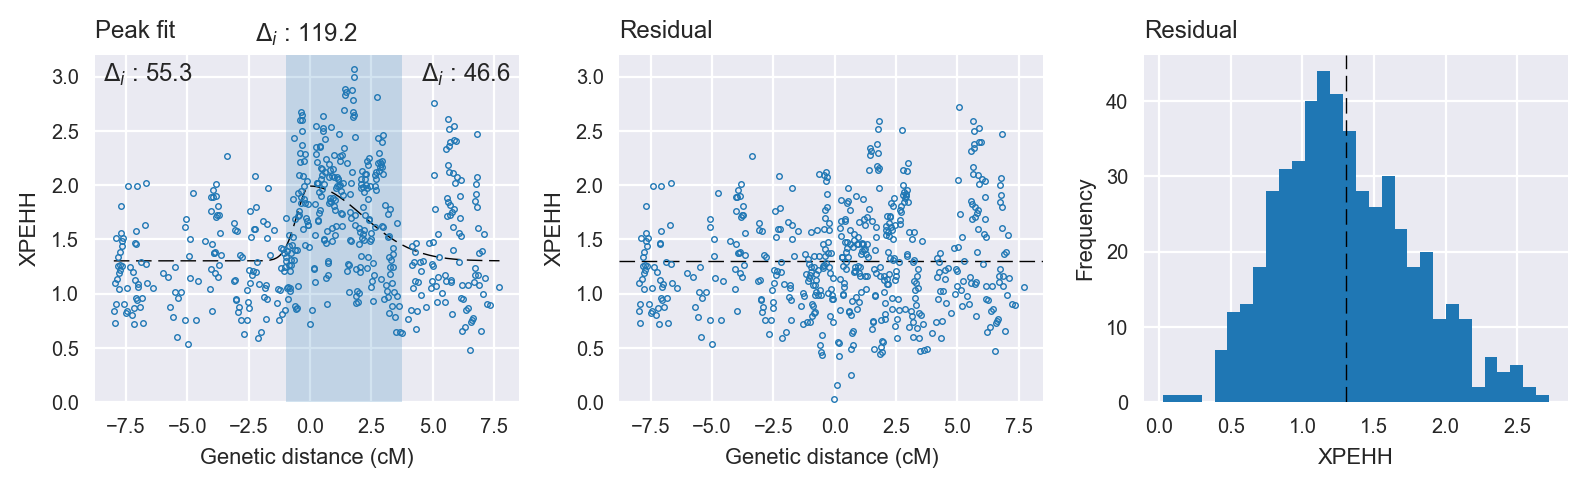
Peak fitting diagnostics. @@TODO
Model fit reports
Peak model:
[[Model]]
    Model(skewed_gaussian)
[[Fit Statistics]]
    # function evals   = 62
    # data points      = 505
    # variables        = 4
    chi-square         = 111.629
    reduced chi-square = 0.223
    Akaike info crit   = -754.237
    Bayesian info crit = -737.339
[[Variables]]
    center:      0 (fixed)
    amplitude:   0.68920177 +/- 0.058090 (8.43%) (init= 3)
    sigma:       1.06905084 +/- 0.131726 (12.32%) (init= 0.5)
    skew:       -0.99999965 +/- 0.131113 (13.11%) (init= 0)
    baseline:    1.30253024 +/- 0.034057 (2.61%) (init= 1)
    ceiling:     100 (fixed)
    floor:       0 (fixed)
[[Correlations]] (unreported correlations are <  0.100)
    C(sigma, baseline)           = -0.478
    C(amplitude, baseline)       = -0.463
    C(sigma, skew)               =  0.364
    C(amplitude, sigma)          = -0.203
Null model:
[[Model]]
    Model(constant)
[[Fit Statistics]]
    # function evals   = 11
    # data points      = 504
    # variables        = 1
    chi-square         = 142.391
    reduced chi-square = 0.283
    Akaike info crit   = -635.055
    Bayesian info crit = -630.832
[[Variables]]
    c:   1.54669208 +/- 0.023699 (1.53%) (init= 1)