XPEHH/GWA.BFS/3/2
This page describes a signal of selection found in the
Guinea Bissau population
when compared with the Burkina Faso An. gambiae population
using the XPEHH (Cite et al. 20XX) statistic.The focus of this signal is on chromosome arm
3R between positions 6,320,000 and
6,360,000.
The evidence supporting this signal is
strong ( >= 100 on both flanks).
Signal location. Blue markers show the values of the selection statistic. The dashed black line shows the fitted peak model. The shaded red area shows the focus of the selection signal. The shaded blue area shows the genomic region in linkage with the selection event. Use the mouse wheel or the controls at the top right of the plot to zoom in, and hover over genes to see gene names and descriptions.
Genes
The following 2 genes overlap the focal region: AGAP013774, AGAP008168.
The following 24 genes are within 50 kbp of the focal region: AGAP008160 (myb proto-oncogene protein), AGAP008161 (ribonuclease H2 subunit B), AGAP008162 (SNARE-associated protein Snapin), AGAP008163 (U4/U6 small nuclear ribonucleoprotein SNU13), AGAP008164 (La-related protein 7), AGAP008165 (cellular retinaldehyde binding protein), AGAP008166 (heparan sulfate 2-O-sulfotransferase HS2ST1), AGAP008167 (abhydrolase domain containing 4), AGAP013740, AGAP008169, AGAP008170, AGAP028664, AGAP028663, AGAP028692, AGAP028691, AGAP008173, AGAP013765, AGAP008174, AGAP008175, AGAP008176 (dipeptidyl-peptidase 4), AGAP008177, AGAP028550, AGAP008178, AGAP008179 (SCRBQ3 - Class B Scavenger Receptor (CD36 domain).).
Key to insecticide resistance candidate gene types: 1 metabolic; 2 target-site; 3 behavioural; 4 cuticular.
Overlapping selection signals
The following selection signals have a focus which overlaps with the focus of this signal.
| Signal | Statistic | Population | Focus | Peak model |
Max. percentile | Known locus |
|---|---|---|---|---|---|---|
| XPEHH/GWA.UGS/3/2 | XPEHH | Guinea Bissau | 3R:6,280,000-6,340,000 | 206 | 99.9% | nan |
| XPEHH/UGS.CMS/3/3 | XPEHH | Uganda An. gambiae | 3R:6,360,000-6,400,000 | 201 | 99.9% | nan |
| XPEHH/UGS.BFS/3/4 | XPEHH | Uganda An. gambiae | 3R:6,360,000-6,400,000 | 137 | 99.9% | nan |
| XPEHH/UGS.GWA/3/2 | XPEHH | Uganda An. gambiae | 3R:6,360,000-6,400,000 | 120 | 99.3% | nan |
Diagnostics
The information below provides some diagnostics from the Peak modelling algorithm.
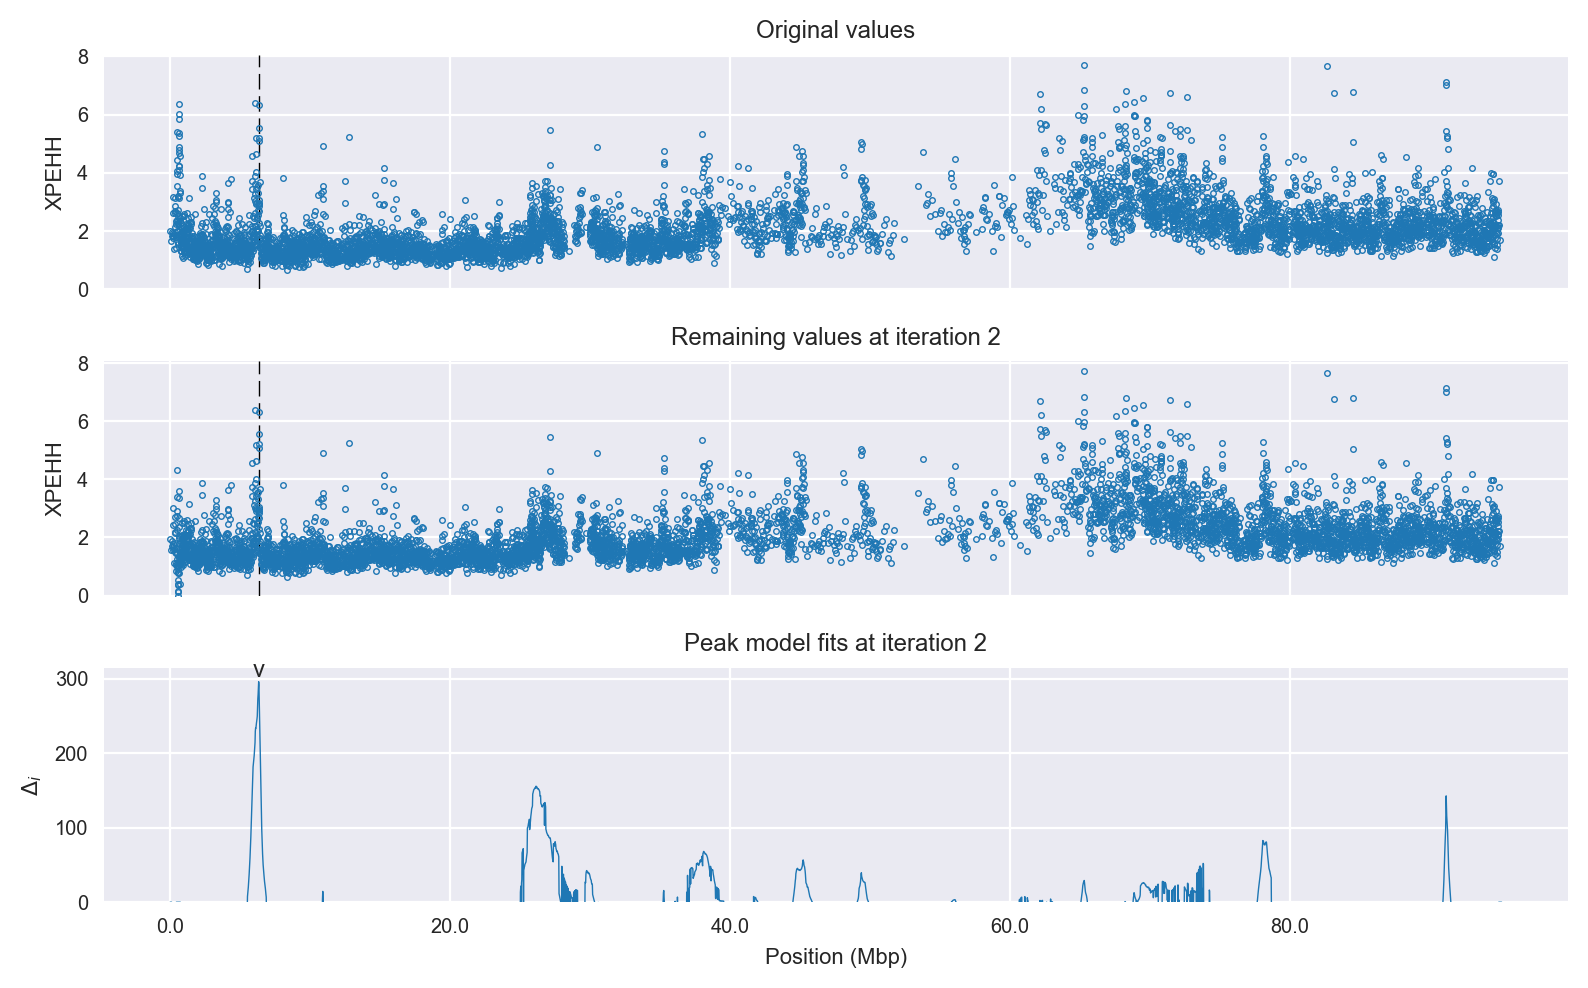
Selection signal in context. @@TODO
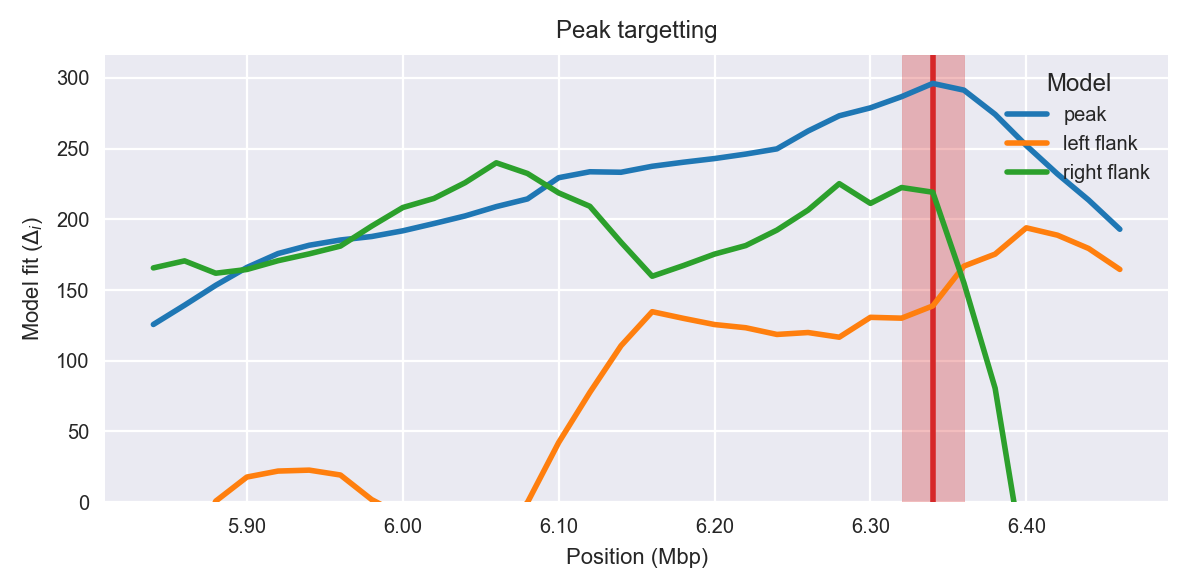
Peak targetting. @@TODO
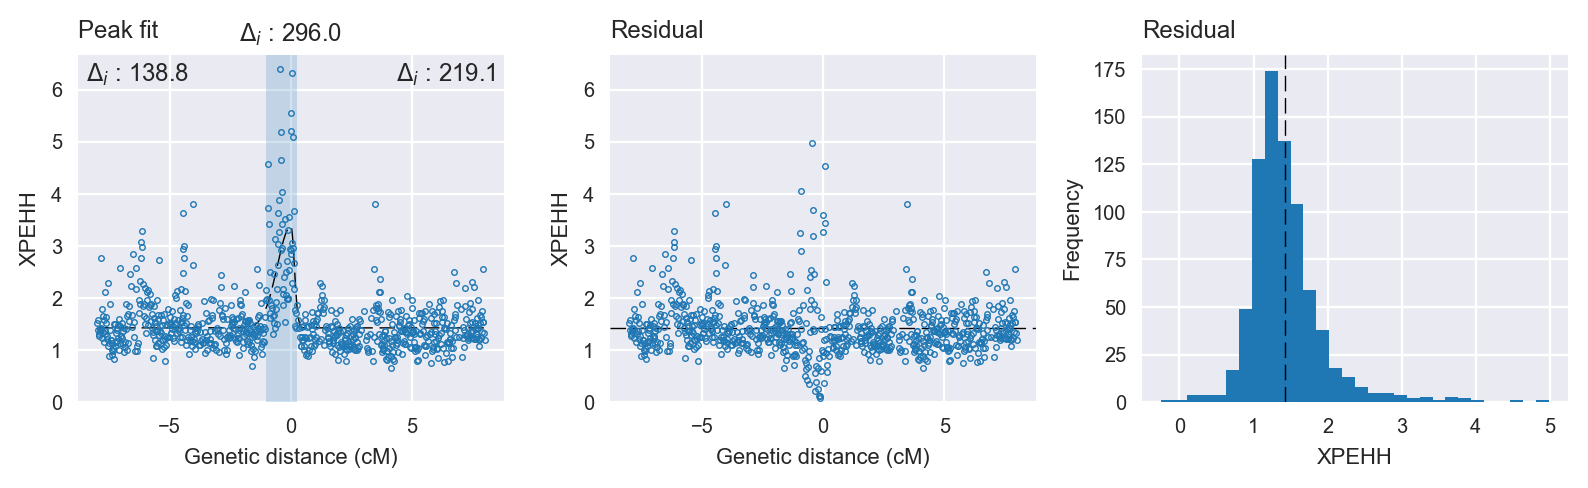
Peak fitting diagnostics. @@TODO
Model fit reports
Peak model:
[[Model]]
    Model(skewed_gaussian)
[[Fit Statistics]]
    # function evals   = 52
    # data points      = 787
    # variables        = 4
    chi-square         = 208.975
    reduced chi-square = 0.267
    Akaike info crit   = -1035.572
    Bayesian info crit = -1016.899
[[Variables]]
    center:      0 (fixed)
    amplitude:   1.94501224 +/- 0.107991 (5.55%) (init= 3)
    sigma:       0.28384080 +/- 0.023949 (8.44%) (init= 0.5)
    skew:        0.99999993 +/- 0.104600 (10.46%) (init= 0)
    baseline:    1.42734526 +/- 0.019674 (1.38%) (init= 1)
    ceiling:     100 (fixed)
    floor:       0 (fixed)
[[Correlations]] (unreported correlations are <  0.100)
    C(sigma, skew)               = -0.570
    C(amplitude, sigma)          = -0.459
    C(sigma, baseline)           = -0.167
    C(amplitude, baseline)       = -0.130
Null model:
[[Model]]
    Model(constant)
[[Fit Statistics]]
    # function evals   = 11
    # data points      = 786
    # variables        = 1
    chi-square         = 305.964
    reduced chi-square = 0.390
    Akaike info crit   = -739.583
    Bayesian info crit = -734.916
[[Variables]]
    c:   1.53944224 +/- 0.022268 (1.45%) (init= 1)