XPEHH/GWA.UGS/2/3
This page describes a signal of selection found in the
Guinea Bissau population
when compared with the Uganda An. gambiae population
using the XPEHH (Cite et al. 20XX) statistic.The focus of this signal is on chromosome arm
2L between positions 48,934,895 and
49,014,895.
The evidence supporting this signal is
weak ( < 50 on one or both flanks).
Signal location. Blue markers show the values of the selection statistic. The dashed black line shows the fitted peak model. The shaded red area shows the focus of the selection signal. The shaded blue area shows the genomic region in linkage with the selection event. Use the mouse wheel or the controls at the top right of the plot to zoom in, and hover over genes to see gene names and descriptions.
Genes
The following 11 genes overlap the focal region: AGAP007675 (dynein, axonemal heavy chain), AGAP007676, AGAP007677, AGAP007678, AGAP007679, AGAP007680, AGAP013037, AGAP007681 (Rad and Gem related GTP binding protein 1), AGAP007682, AGAP007683 (Vacuolar protein sorting-associated protein 35), AGAP007684 (Tubulointerstitial nephritis antigen).
The following 11 genes are within 50 kbp of the focal region: AGAP007667 (sugar transporter ERD6-like 4), AGAP007668 (eIF3g - Eukaryotic translation initiation factor 3 subunit G), AGAP007669, AGAP007670 (U2 small nuclear ribonucleoprotein A), AGAP007671, AGAP007672 (pancreatic triacylglycerol lipase), AGAP007673, AGAP007674 (GIPC PDZ domain containing family, member 2), AGAP007685, AGAP007686 (50 kDa dystrophin-associated glycoprotein), AGAP007687 (Oxysterol-binding protein).
Key to insecticide resistance candidate gene types: 1 metabolic; 2 target-site; 3 behavioural; 4 cuticular.
Diagnostics
The information below provides some diagnostics from the Peak modelling algorithm.
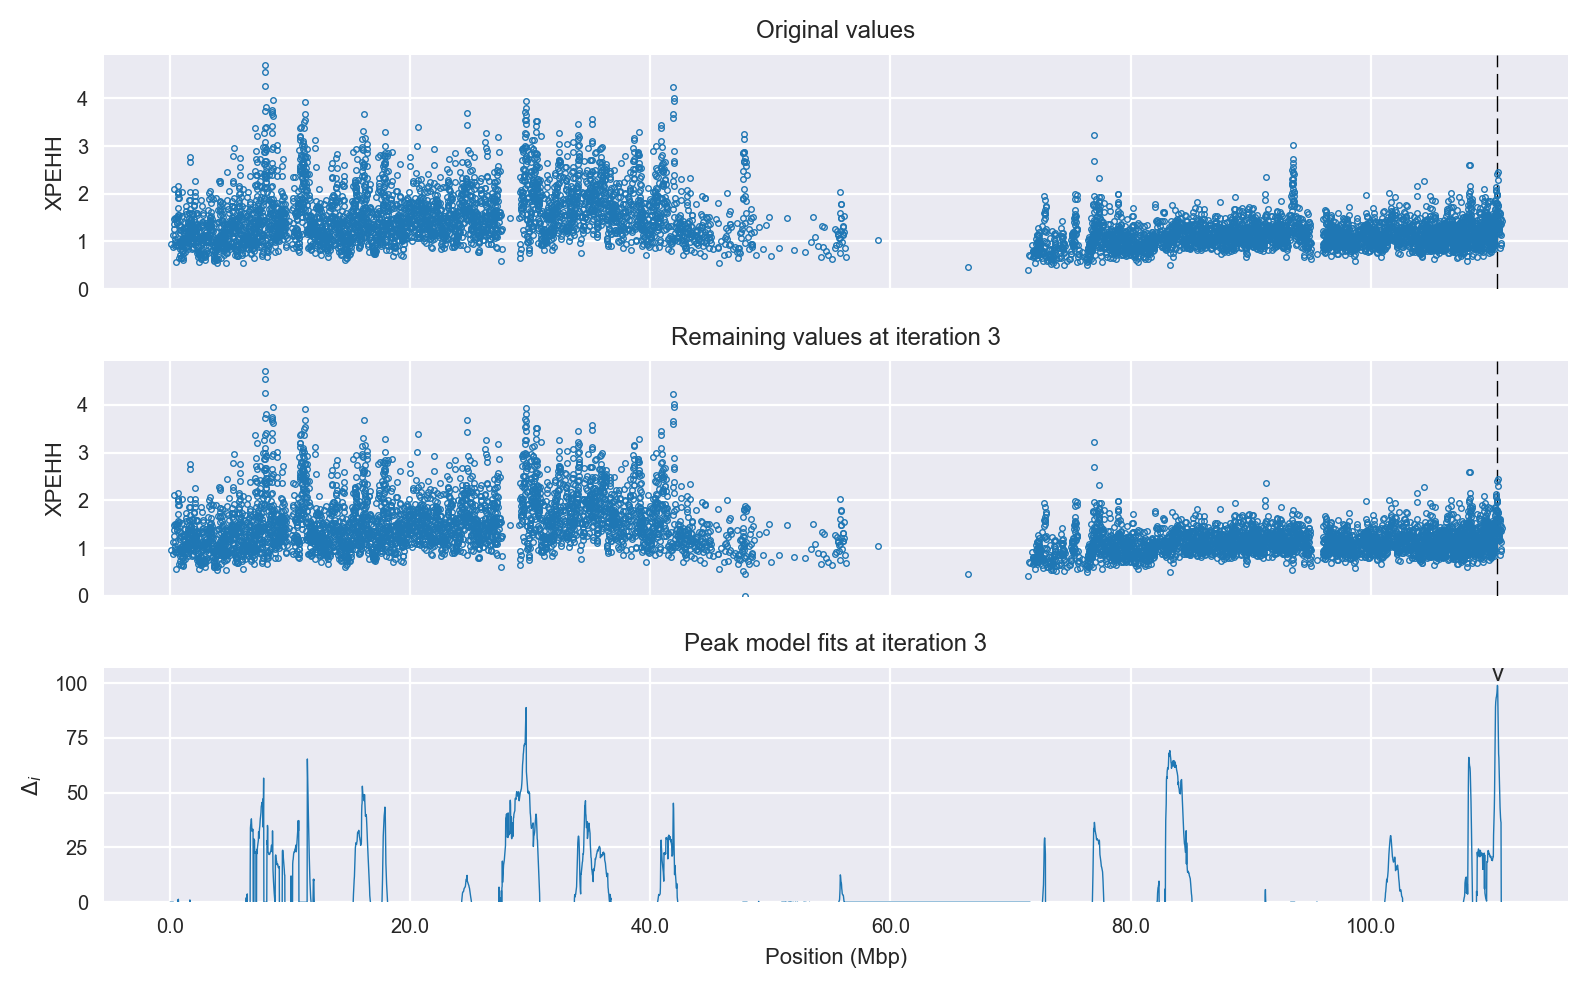
Selection signal in context. @@TODO
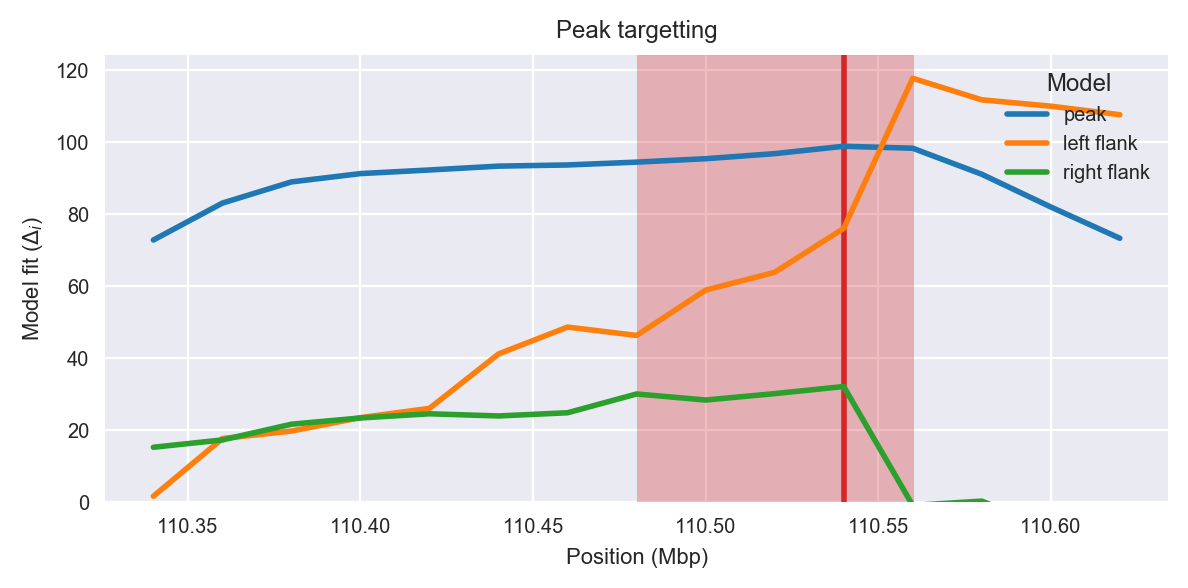
Peak targetting. @@TODO
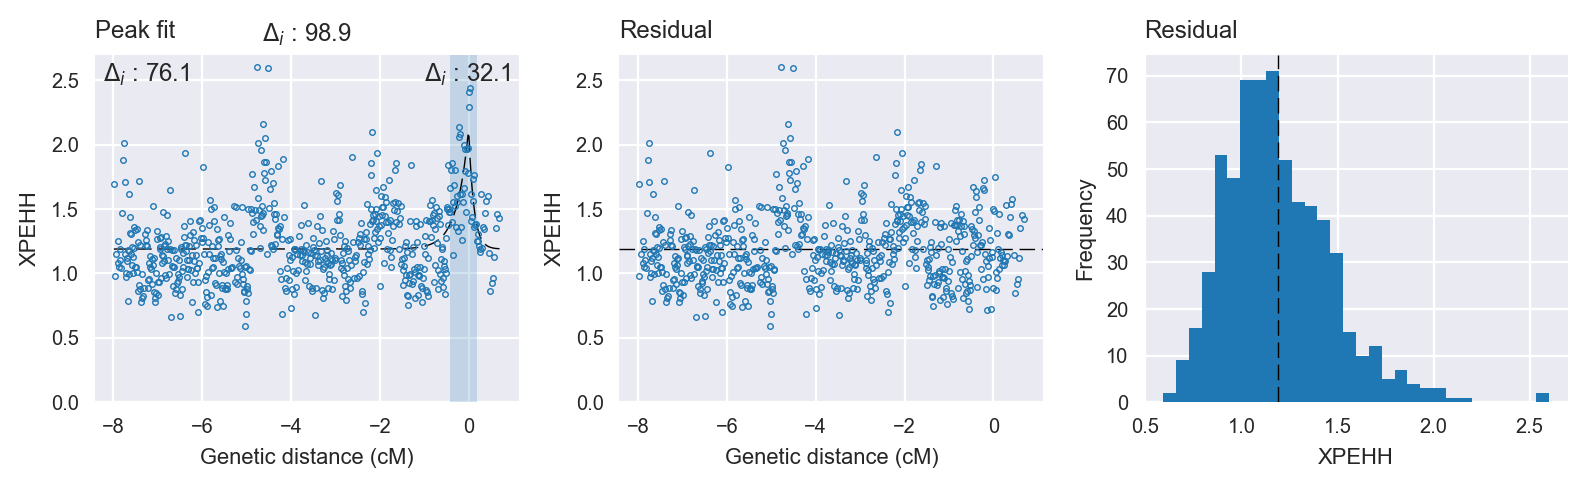
Peak fitting diagnostics. @@TODO
Model fit reports
Peak model:
[[Model]]
    Model(skewed_exponential_peak)
[[Fit Statistics]]
    # function evals   = 33
    # data points      = 636
    # variables        = 4
    chi-square         = 49.391
    reduced chi-square = 0.078
    Akaike info crit   = -1617.258
    Bayesian info crit = -1599.437
[[Variables]]
    center:      0 (fixed)
    amplitude:   0.92943441 +/- 0.108928 (11.72%) (init= 3)
    decay:       0.17467717 +/- 0.031992 (18.32%) (init= 0.5)
    skew:        0.60097362 +/- 0.189482 (31.53%) (init= 0)
    baseline:    1.18944495 +/- 0.012136 (1.02%) (init= 1)
    ceiling:     100 (fixed)
    floor:       0 (fixed)
[[Correlations]] (unreported correlations are <  0.100)
    C(amplitude, decay)          = -0.642
    C(decay, skew)               = -0.364
    C(decay, baseline)           = -0.269
Null model:
[[Model]]
    Model(constant)
[[Fit Statistics]]
    # function evals   = 9
    # data points      = 635
    # variables        = 1
    chi-square         = 57.933
    reduced chi-square = 0.091
    Akaike info crit   = -1518.408
    Bayesian info crit = -1513.954
[[Variables]]
    c:   1.22621306 +/- 0.011995 (0.98%) (init= 1)