XPEHH/GWA.UGS/2/4
This page describes a signal of selection found in the
Guinea Bissau population
when compared with the Uganda An. gambiae population
using the XPEHH (Cite et al. 20XX) statistic.The focus of this signal is on chromosome arm
2L between positions 46,594,895 and
46,654,895.
The evidence supporting this signal is
weak ( < 50 on one or both flanks).
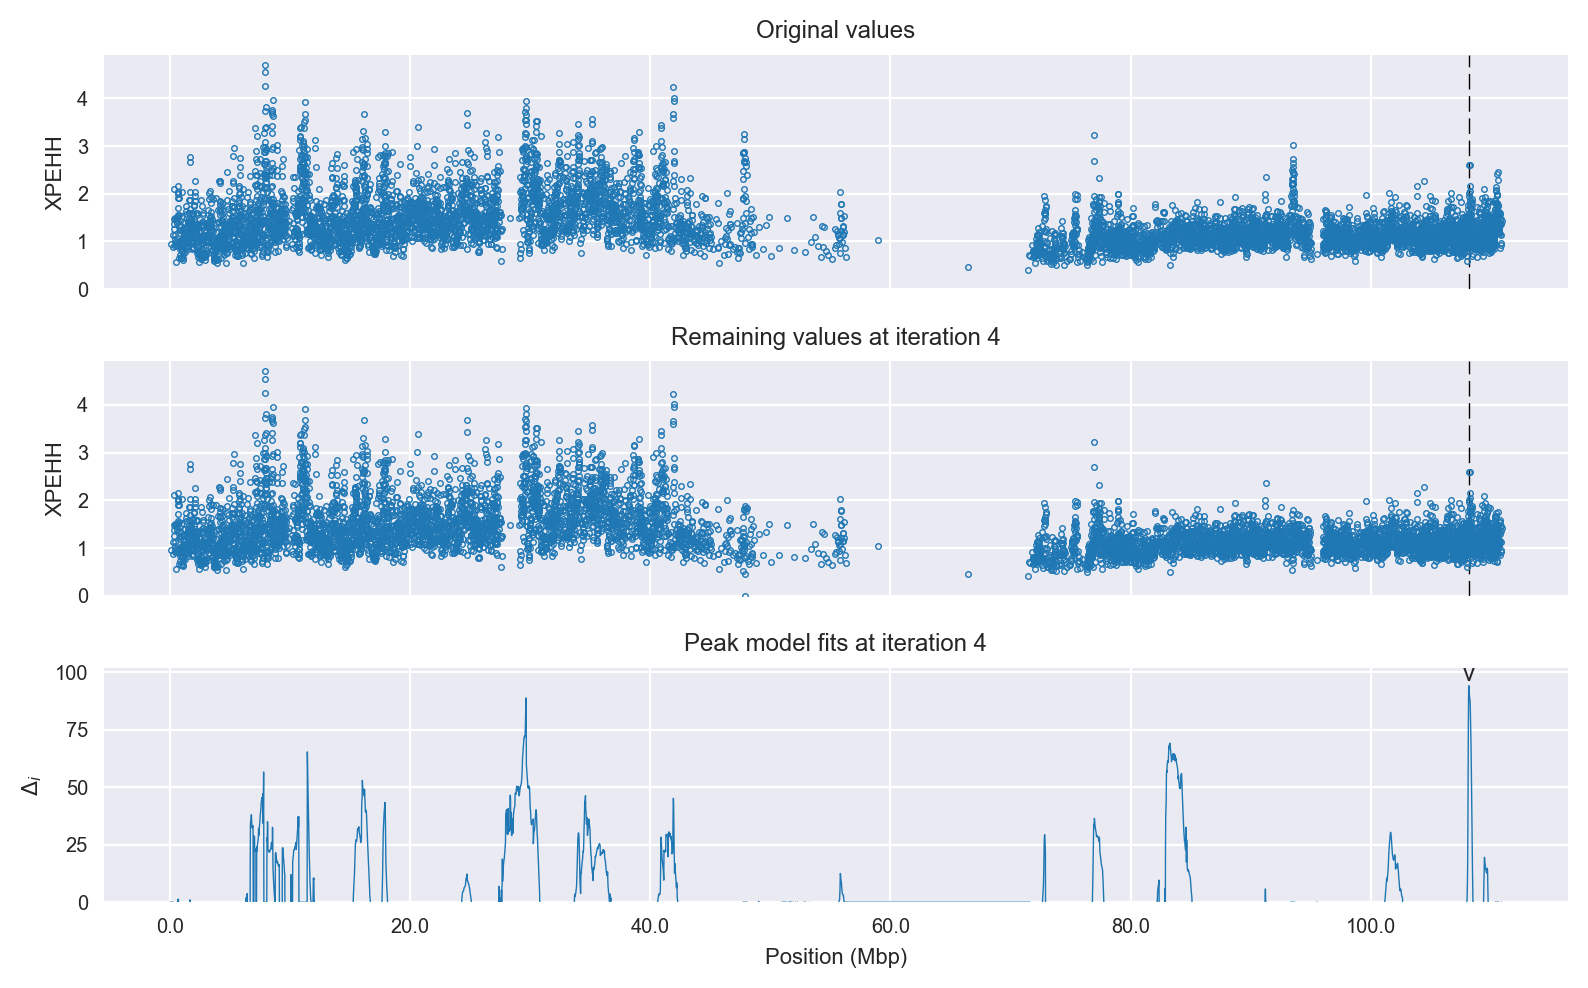
Signal location. Blue markers show the values of the selection statistic. The dashed black line shows the fitted peak model. The shaded red area shows the focus of the selection signal. The shaded blue area shows the genomic region in linkage with the selection event. Use the mouse wheel or the controls at the top right of the plot to zoom in, and hover over genes to see gene names and descriptions.
Genes
The following 14 genes overlap the focal region: AGAP007439, AGAP007440 (DNA topoisomerase 2-associated protein PAT1), AGAP007442, AGAP007443, AGAP007445, AGAP007446, AGAP007450 (hairy and enhancer of split related with YRPW motif), AGAP007451, AGAP007452 (neuronal guanine nucleotide exchange factor), AGAP007453 (LRIM9 - leucine-rich immune protein (Short)), AGAP007454 (LRIM8A - leucine-rich immune protein (Short)), AGAP007455 (LRIM10 - leucine-rich immune protein (Short)), AGAP007456 (LRIM8B - leucine-rich immune protein (Short)), AGAP007457 (LRIM7 - leucine-rich immune protein (Short)).
The following 5 genes are within 50 kbp of the focal region: AGAP0074201 (peptidylglycine monooxygenase), AGAP007421 (Similar to mandelate racemase/muconate lactonizing protein), AGAP007422, AGAP007423 (chromosome transmission fidelity protein 4), AGAP007458.
Key to insecticide resistance candidate gene types: 1 metabolic; 2 target-site; 3 behavioural; 4 cuticular.
Diagnostics
The information below provides some diagnostics from the Peak modelling algorithm.
Selection signal in context. @@TODO
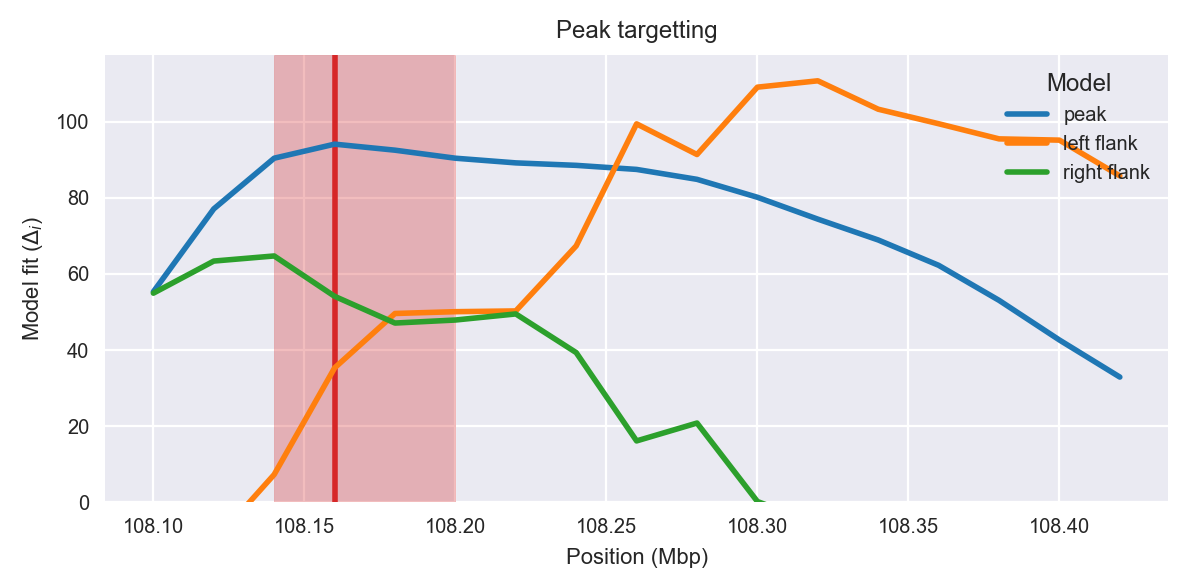
Peak targetting. @@TODO
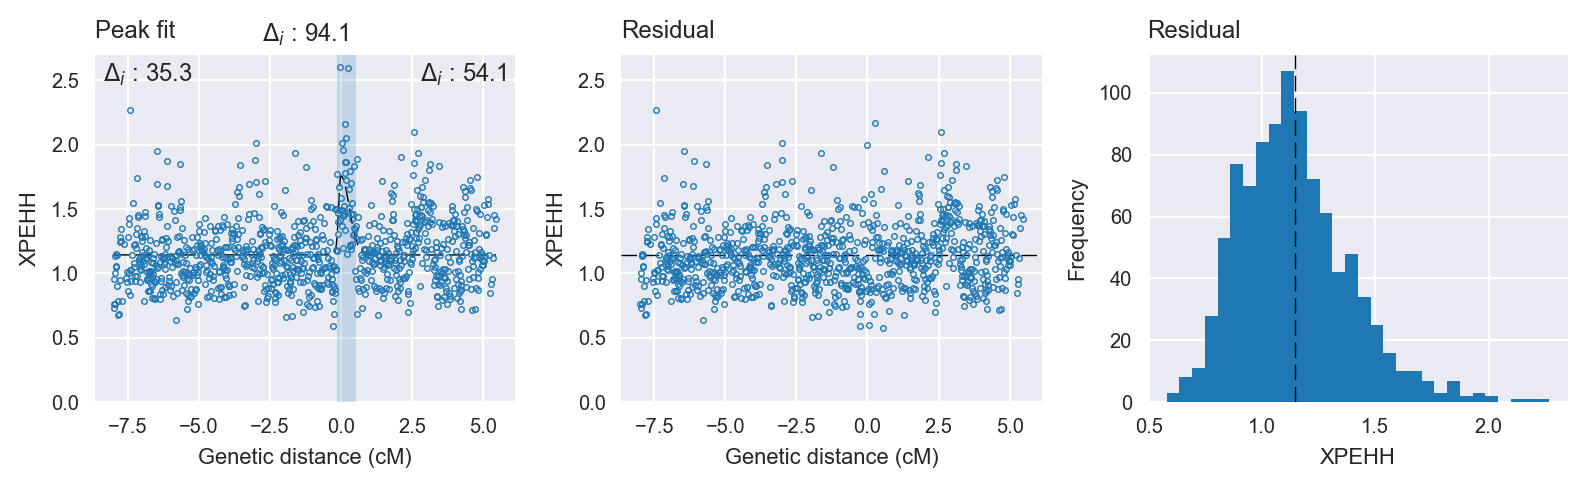
Peak fitting diagnostics. @@TODO
Model fit reports
Peak model:
[[Model]]
    Model(skewed_gaussian)
[[Fit Statistics]]
    # function evals   = 64
    # data points      = 970
    # variables        = 4
    chi-square         = 59.471
    reduced chi-square = 0.062
    Akaike info crit   = -2700.056
    Bayesian info crit = -2680.547
[[Variables]]
    center:      0 (fixed)
    amplitude:   0.61322625 +/- 0.063154 (10.30%) (init= 3)
    sigma:       0.15371765 +/- 0.020766 (13.51%) (init= 0.5)
    skew:       -0.93512925 +/- 0.164695 (17.61%) (init= 0)
    baseline:    1.14363285 +/- 0.008266 (0.72%) (init= 1)
    ceiling:     100 (fixed)
    floor:       0 (fixed)
[[Correlations]] (unreported correlations are <  0.100)
    C(amplitude, sigma)          = -0.479
    C(sigma, skew)               =  0.435
    C(sigma, baseline)           = -0.143
Null model:
[[Model]]
    Model(constant)
[[Fit Statistics]]
    # function evals   = 9
    # data points      = 969
    # variables        = 1
    chi-square         = 65.682
    reduced chi-square = 0.068
    Akaike info crit   = -2606.003
    Bayesian info crit = -2601.127
[[Variables]]
    c:   1.16276141 +/- 0.008368 (0.72%) (init= 1)