H12/BFM/3/1
This page describes a signal of selection found in the
Burkina Faso An. coluzzii populationusing the H12 (Garud et al. 20XX) statistic.The focus of this signal is on chromosome arm
3R between positions 28,560,000 and
28,620,000.
The evidence supporting this signal is
strong ( >= 100 on both flanks).
This signal overlaps the Gste locus, a genome region with prior evidence of an association with insecticide resistance and/or recent positive selection in Anopheles mosquitoes.
Signal location. Blue markers show the values of the selection statistic. The dashed black line shows the fitted peak model. The shaded red area shows the focus of the selection signal. The shaded blue area shows the genomic region in linkage with the selection event. Use the mouse wheel or the controls at the top right of the plot to zoom in, and hover over genes to see gene names and descriptions.
Genes
The following 15 genes overlap the focal region: AGAP009185, AGAP0091871 (Indanol dehydrogenase), AGAP009188 (solute carrier family 39 (zinc transporter), member 9), AGAP009189, AGAP0091901 (GSTE8 - glutathione S-transferase epsilon class 8), AGAP0091911 (GSTE6 - glutathione S-transferase epsilon class 6), AGAP0091921 (GSTE5 - glutathione S-transferase epsilon class 5), AGAP0091931 (GSTE4 - glutathione S-transferase epsilon class 4), AGAP0091941 (GSTE2 - glutathione S-transferase epsilon class 2), AGAP0091951 (GSTE1 - glutathione S-transferase epsilon class 1), AGAP0091961 (GSTE7 - glutathione S-transferase epsilon class 7), AGAP0091971 (GSTE3 - glutathione S-transferase epsilon class 3), AGAP009198, AGAP009199 (palmitoyltransferase ZDHHC24), AGAP009200 (collagen type IV alpha).
The following 4 genes are within 50 kbp of the focal region: AGAP009201 (collagen type IV alpha), AGAP009202 (selenoprotein T), AGAP028058, AGAP009203 (SPRY domain-containing SOCS box protein 3).
Key to insecticide resistance candidate gene types: 1 metabolic; 2 target-site; 3 behavioural; 4 cuticular.
Overlapping selection signals
The following selection signals have a focus which overlaps with the focus of this signal.
| Signal | Statistic | Population | Focus | Peak model |
Max. percentile | Known locus |
|---|---|---|---|---|---|---|
| H12/CMS/3/1 | H12 | Cameroon An. gambiae | 3R:28,580,000-28,620,000 | 1,410 | 100.0% | Gste |
| XPEHH/CMS.GWA/3/1 | XPEHH | Cameroon An. gambiae | 3R:28,600,000-28,700,000 | 1,275 | 100.0% | Gste |
| XPEHH/BFS.GWA/3/1 | XPEHH | Burkina Faso An. gambiae | 3R:28,500,000-28,620,000 | 1,181 | 100.0% | Gste |
| IHS/CMS/3/1 | IHS | Cameroon An. gambiae | 3R:28,320,000-28,700,000 | 1,106 | 100.0% | Gste |
| IHS/BFM/3/1 | IHS | Burkina Faso An. coluzzii | 3R:28,260,000-28,620,000 | 1,058 | 100.0% | Gste |
| H12/BFS/3/1 | H12 | Burkina Faso An. gambiae | 3R:28,520,000-28,580,000 | 995 | 98.4% | Gste |
| H12/UGS/3/1 | H12 | Uganda An. gambiae | 3R:28,560,000-28,600,000 | 876 | 97.3% | Gste |
| XPEHH/BFM.GWA/3/1 | XPEHH | Burkina Faso An. coluzzii | 3R:28,600,000-28,660,000 | 767 | 100.0% | Gste |
| XPEHH/UGS.GWA/3/1 | XPEHH | Uganda An. gambiae | 3R:28,540,000-28,600,000 | 662 | 100.0% | Gste |
| XPEHH/BFM.AOM/3/1 | XPEHH | Burkina Faso An. coluzzii | 3R:28,600,000-28,640,000 | 569 | 100.0% | Gste |
| IHS/UGS/3/1 | IHS | Uganda An. gambiae | 3R:28,440,000-28,640,000 | 493 | 99.7% | Gste |
| XPEHH/GAS.GWA/3/1 | XPEHH | Gabon An. gambiae | 3R:28,540,000-28,620,000 | 129 | 100.0% | Gste |
Diagnostics
The information below provides some diagnostics from the Peak modelling algorithm.
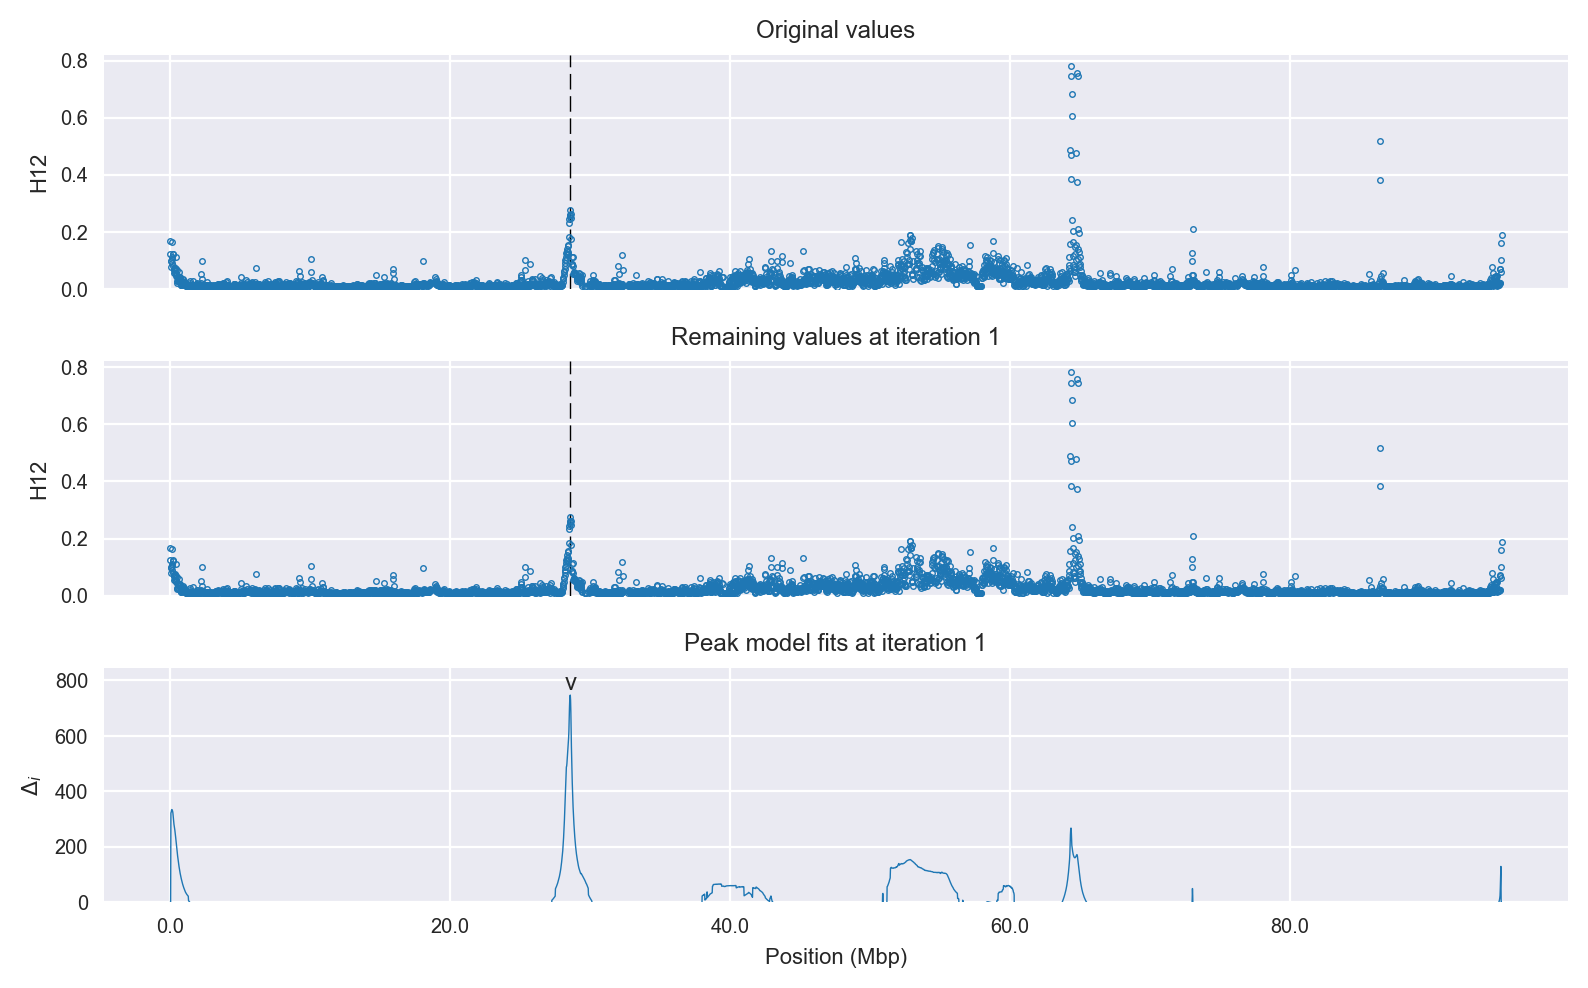
Selection signal in context. @@TODO
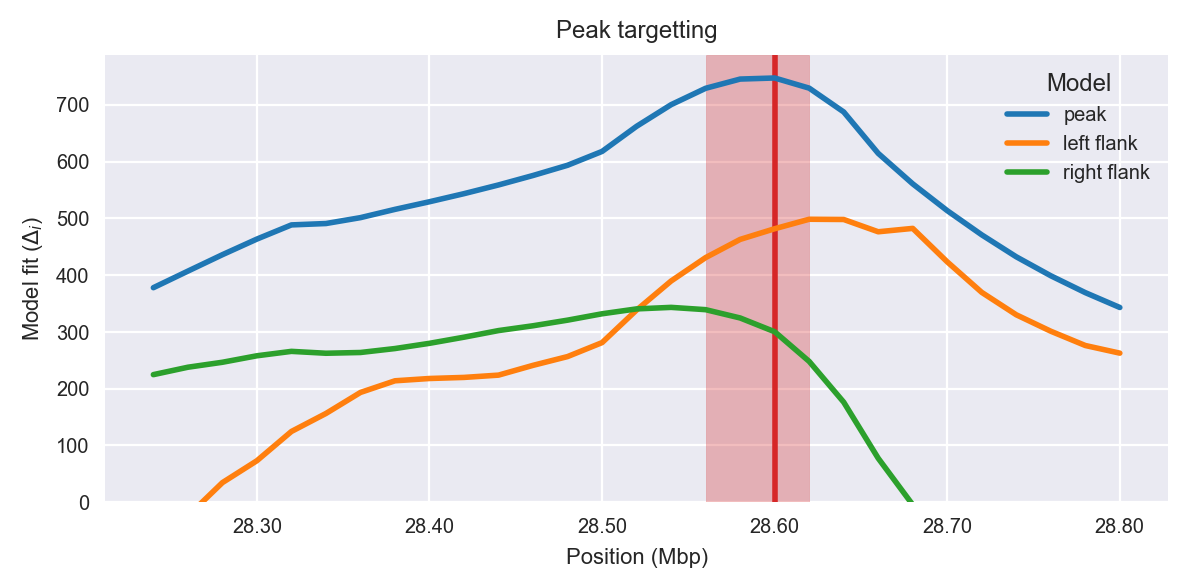
Peak targetting. @@TODO
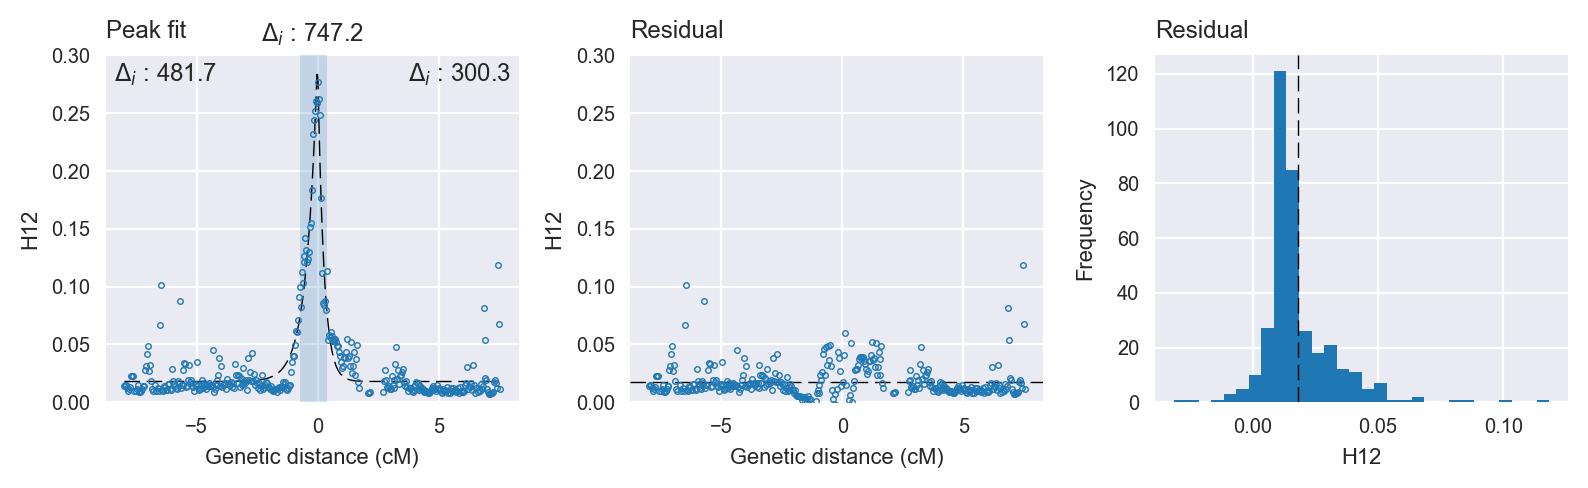
Peak fitting diagnostics. @@TODO
Model fit reports
Peak model:
[[Model]]
    Model(skewed_exponential_peak)
[[Fit Statistics]]
    # function evals   = 43
    # data points      = 362
    # variables        = 4
    chi-square         = 0.082
    reduced chi-square = 0.000
    Akaike info crit   = -3028.746
    Bayesian info crit = -3013.179
[[Variables]]
    center:      0 (fixed)
    amplitude:   0.28102171 +/- 0.007274 (2.59%) (init= 0.5)
    decay:       0.33679735 +/- 0.013274 (3.94%) (init= 0.5)
    skew:        0.41588151 +/- 0.038724 (9.31%) (init= 0)
    baseline:    0.01792219 +/- 0.000887 (4.95%) (init= 0.03)
    ceiling:     1 (fixed)
    floor:       0 (fixed)
[[Correlations]] (unreported correlations are <  0.100)
    C(amplitude, decay)          = -0.659
    C(decay, baseline)           = -0.320
    C(decay, skew)               = -0.191
Null model:
[[Model]]
    Model(constant)
[[Fit Statistics]]
    # function evals   = 7
    # data points      = 361
    # variables        = 1
    chi-square         = 0.646
    reduced chi-square = 0.002
    Akaike info crit   = -2281.572
    Bayesian info crit = -2277.683
[[Variables]]
    c:   0.03084968 +/- 0.002229 (7.23%) (init= 0.03)