H12/CMS/2/4
This page describes a signal of selection found in the
Cameroon An. gambiae populationusing the H12 (Garud et al. 20XX) statistic.The focus of this signal is on chromosome arm
2L between positions 39,274,895 and
39,314,895.
The evidence supporting this signal is
weak ( < 50 on one or both flanks).
Signal location. Blue markers show the values of the selection statistic. The dashed black line shows the fitted peak model. The shaded red area shows the focus of the selection signal. The shaded blue area shows the genomic region in linkage with the selection event. Use the mouse wheel or the controls at the top right of the plot to zoom in, and hover over genes to see gene names and descriptions.
Genes
The following 10 genes overlap the focal region: AGAP0068684 (CPR140 - cuticular protein RR-1 family 140), AGAP006869 (eupolytin), AGAP0068703, AGAP006871 (RpS4 - 40S ribosomal protein S4), AGAP006872 (NIMA (never in mitosis gene a)-related kinase), AGAP006873 (Ras-related protein Rab-8A), AGAP0068743 (Gr29 - gustatory receptor 29), AGAP0068753 (Gr30 - gustatory receptor 30), AGAP0068763 (Gr31 - gustatory receptor 31), AGAP0068773 (Gr32 - gustatory receptor 32).
The following 10 genes are within 50 kbp of the focal region: AGAP0068664 (CPR63 - cuticular protein RR-1 family 63), AGAP0068674 (CPR141 - cuticular protein RR-1 family 141), AGAP006878 (mitochondrial complex I protein Fmp36), AGAP006879 (F-type H -transporting ATPase subunit e), AGAP006880 (Protein LMBR1L), AGAP006881 (Polypeptide N-acetylgalactosaminyltransferase (Fragment)), AGAP006882, AGAP006883, AGAP006884, AGAP006885 (pre-mRNA-processing factor 8).
Key to insecticide resistance candidate gene types: 1 metabolic; 2 target-site; 3 behavioural; 4 cuticular.
Overlapping selection signals
The following selection signals have a focus which overlaps with the focus of this signal.
| Signal | Statistic | Population | Focus | Peak model |
Max. percentile | Known locus |
|---|---|---|---|---|---|---|
| IHS/CMS/2/5 | IHS | Cameroon An. gambiae | 2L:39,274,895-39,314,895 | 137 | 95.6% | nan |
| IHS/GNS/2/4 | IHS | Guinea An. gambiae | 2L:39,274,895-39,314,895 | 119 | 96.8% | nan |
| H12/GNS/2/5 | H12 | Guinea An. gambiae | 2L:39,254,895-39,294,895 | 110 | 94.7% | nan |
Diagnostics
The information below provides some diagnostics from the Peak modelling algorithm.
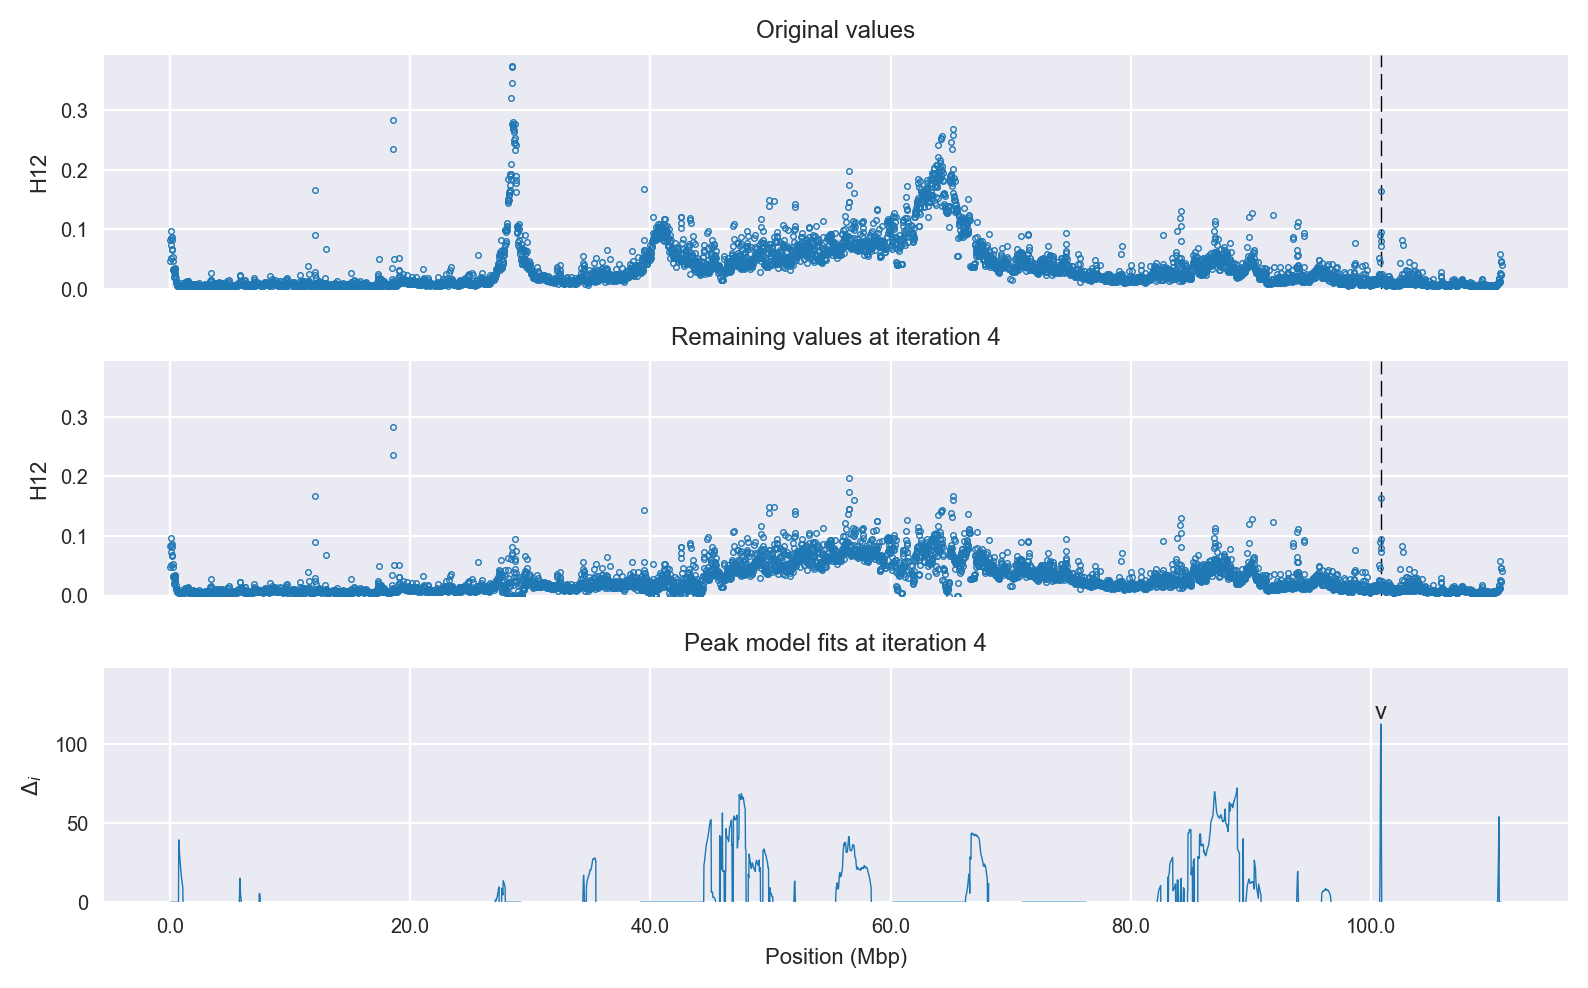
Selection signal in context. @@TODO
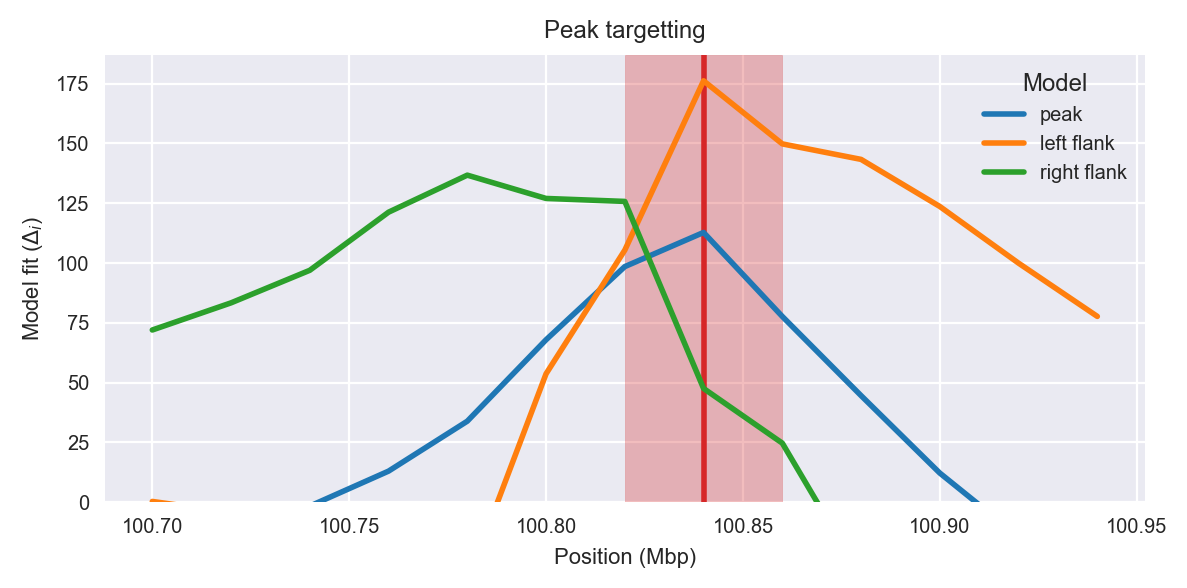
Peak targetting. @@TODO
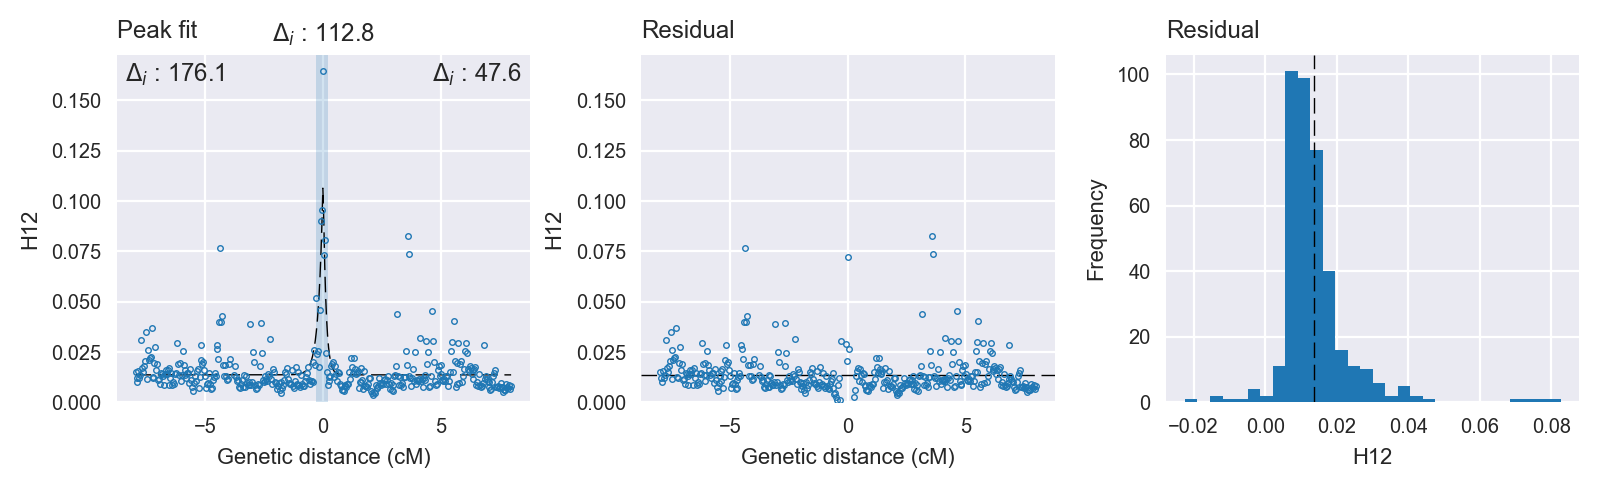
Peak fitting diagnostics. @@TODO
Model fit reports
Peak model:
[[Model]]
    Model(skewed_exponential_peak)
[[Fit Statistics]]
    # function evals   = 48
    # data points      = 396
    # variables        = 4
    chi-square         = 0.041
    reduced chi-square = 0.000
    Akaike info crit   = -3625.943
    Bayesian info crit = -3610.017
[[Variables]]
    center:      0 (fixed)
    amplitude:   0.09764949 +/- 0.007382 (7.56%) (init= 0.5)
    decay:       0.15000000 +/- 0.016494 (11.00%) (init= 0.5)
    skew:        0.34543536 +/- 0.111797 (32.36%) (init= 0)
    baseline:    0.01359976 +/- 0.000535 (3.93%) (init= 0.03)
    ceiling:     1 (fixed)
    floor:       0 (fixed)
[[Correlations]] (unreported correlations are <  0.100)
    C(amplitude, decay)          = -0.685
    C(decay, baseline)           = -0.199
    C(decay, skew)               = -0.162
Null model:
[[Model]]
    Model(constant)
[[Fit Statistics]]
    # function evals   = 11
    # data points      = 395
    # variables        = 1
    chi-square         = 0.054
    reduced chi-square = 0.000
    Akaike info crit   = -3513.183
    Bayesian info crit = -3509.204
[[Variables]]
    c:   0.01512359 +/- 0.000589 (3.89%) (init= 0.03)