H12/GAS/2/3
This page describes a signal of selection found in the
Gabon An. gambiae populationusing the H12 (Garud et al. 20XX) statistic.The focus of this signal is on chromosome arm
2L between positions 14,694,895 and
14,814,895.
The evidence supporting this signal is
weak ( < 50 on one or both flanks).
Signal location. Blue markers show the values of the selection statistic. The dashed black line shows the fitted peak model. The shaded red area shows the focus of the selection signal. The shaded blue area shows the genomic region in linkage with the selection event. Use the mouse wheel or the controls at the top right of the plot to zoom in, and hover over genes to see gene names and descriptions.
Genes
The following 10 genes overlap the focal region: AGAP005369, AGAP005370 (COEBE4C - carboxylesterase beta esterase), AGAP0053711 (COEBE2C - carboxylesterase beta esterase), AGAP0053721 (COEBE3C - carboxylesterase beta esterase), AGAP0053731 (COEBE1C - carboxylesterase beta esterase), AGAP005374, AGAP005375 (nonsense-mediated mRNA decay protein), AGAP005376, AGAP005377, AGAP005378.
The following 20 genes are within 50 kbp of the focal region: AGAP005360 (PQ loop repeat-containing protein 3), AGAP005361, AGAP005362 (NF-X1-type zinc finger protein NFXL1), AGAP005363, AGAP005364 (protein BAT5), AGAP005365 (ribosome biogenesis protein BRX1), AGAP005366 (serine/arginine repetitive matrix protein 1), AGAP005368, AGAP005379, AGAP005380, AGAP005381 (hexosaminidase), AGAP005382 (transcription initiation factor TFIIE subunit beta), AGAP005383 (cellular retinaldehyde binding protein), AGAP005384 (phosphatidylinositol transfer protein SEC14), AGAP005385 (phosphatidylinositol transfer protein SEC14), AGAP005386, AGAP005387 (cellular retinaldehyde binding protein), AGAP005388 (cellular retinaldehyde binding protein), AGAP005389, AGAP005390.
Key to insecticide resistance candidate gene types: 1 metabolic; 2 target-site; 3 behavioural; 4 cuticular.
Overlapping selection signals
The following selection signals have a focus which overlaps with the focus of this signal.
| Signal | Statistic | Population | Focus | Peak model |
Max. percentile | Known locus |
|---|---|---|---|---|---|---|
| XPEHH/GAS.AOM/2/1 | XPEHH | Gabon An. gambiae | 2L:14,654,895-14,834,895 | 134 | 99.6% | nan |
Diagnostics
The information below provides some diagnostics from the Peak modelling algorithm.
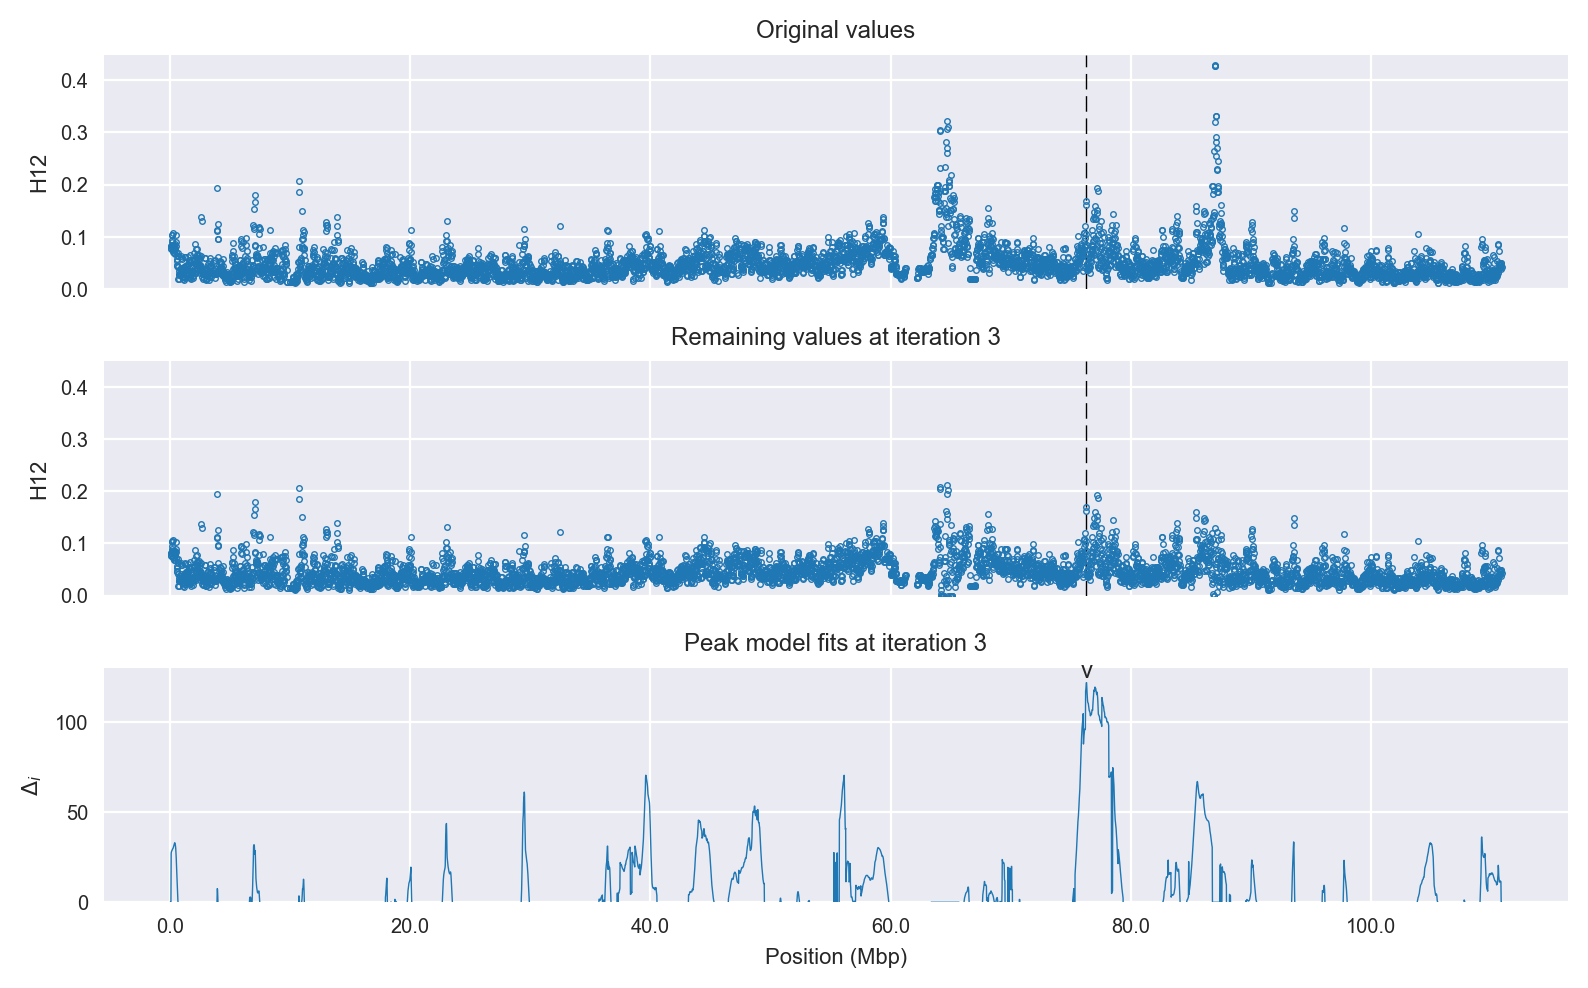
Selection signal in context. @@TODO
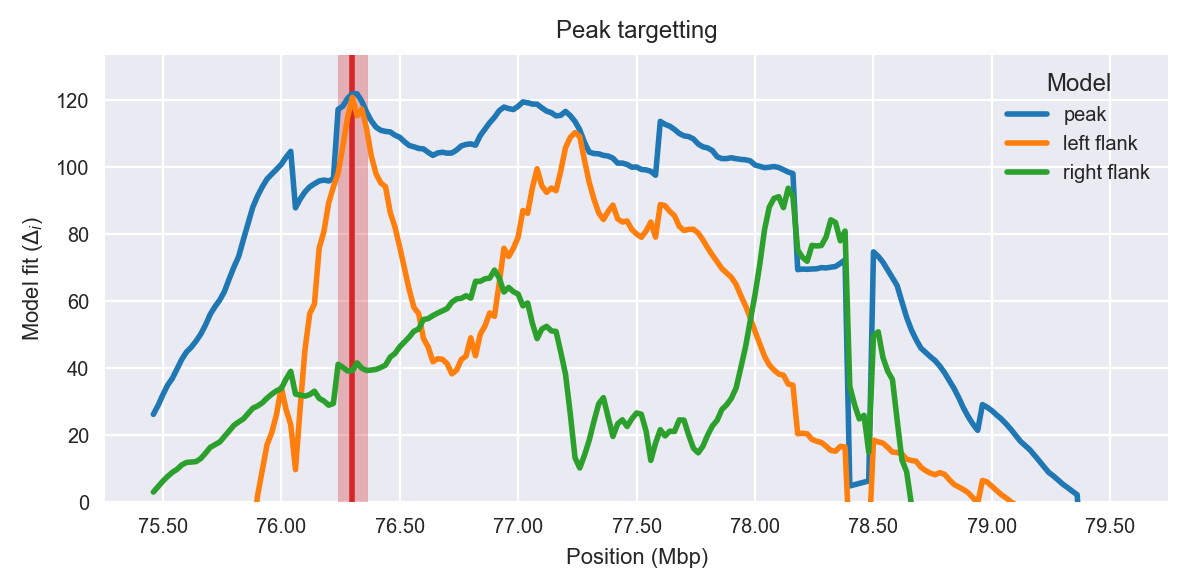
Peak targetting. @@TODO
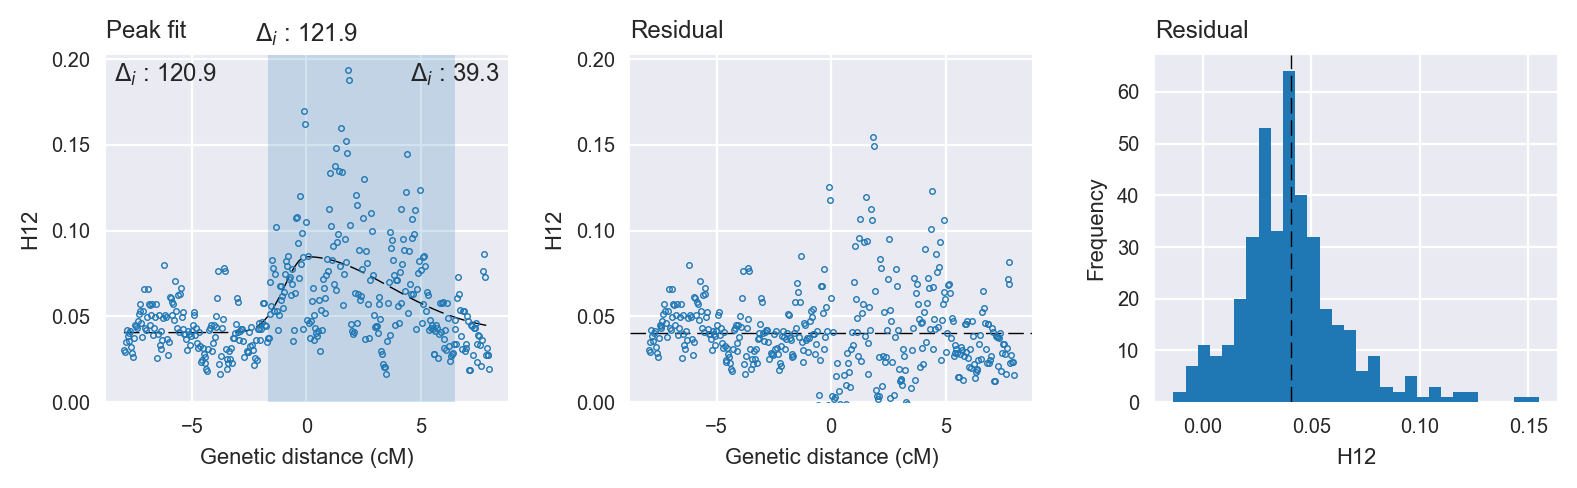
Peak fitting diagnostics. @@TODO
Model fit reports
Peak model:
[[Model]]
    Model(skewed_gaussian)
[[Fit Statistics]]
    # function evals   = 73
    # data points      = 397
    # variables        = 4
    chi-square         = 0.233
    reduced chi-square = 0.001
    Akaike info crit   = -2945.657
    Bayesian info crit = -2929.722
[[Variables]]
    center:      0 (fixed)
    amplitude:   0.04424056 +/- 0.003435 (7.77%) (init= 0.5)
    sigma:       1.86856880 +/- 0.199881 (10.70%) (init= 0.5)
    skew:       -0.95677923 +/- 0.113354 (11.85%) (init= 0)
    baseline:    0.04054460 +/- 0.002052 (5.06%) (init= 0.03)
    ceiling:     1 (fixed)
    floor:       0 (fixed)
[[Correlations]] (unreported correlations are <  0.100)
    C(sigma, baseline)           = -0.525
    C(amplitude, baseline)       = -0.490
    C(sigma, skew)               =  0.430
    C(amplitude, sigma)          = -0.122
Null model:
[[Model]]
    Model(constant)
[[Fit Statistics]]
    # function evals   = 11
    # data points      = 396
    # variables        = 1
    chi-square         = 0.315
    reduced chi-square = 0.001
    Akaike info crit   = -2823.719
    Bayesian info crit = -2819.738
[[Variables]]
    c:   0.05578867 +/- 0.001419 (2.54%) (init= 0.03)