H12/GAS/X/1
This page describes a signal of selection found in the
Gabon An. gambiae populationusing the H12 (Garud et al. 20XX) statistic.The focus of this signal is on chromosome arm
X between positions 13,920,000 and
14,440,000.
The evidence supporting this signal is
strong ( >= 100 on both flanks).
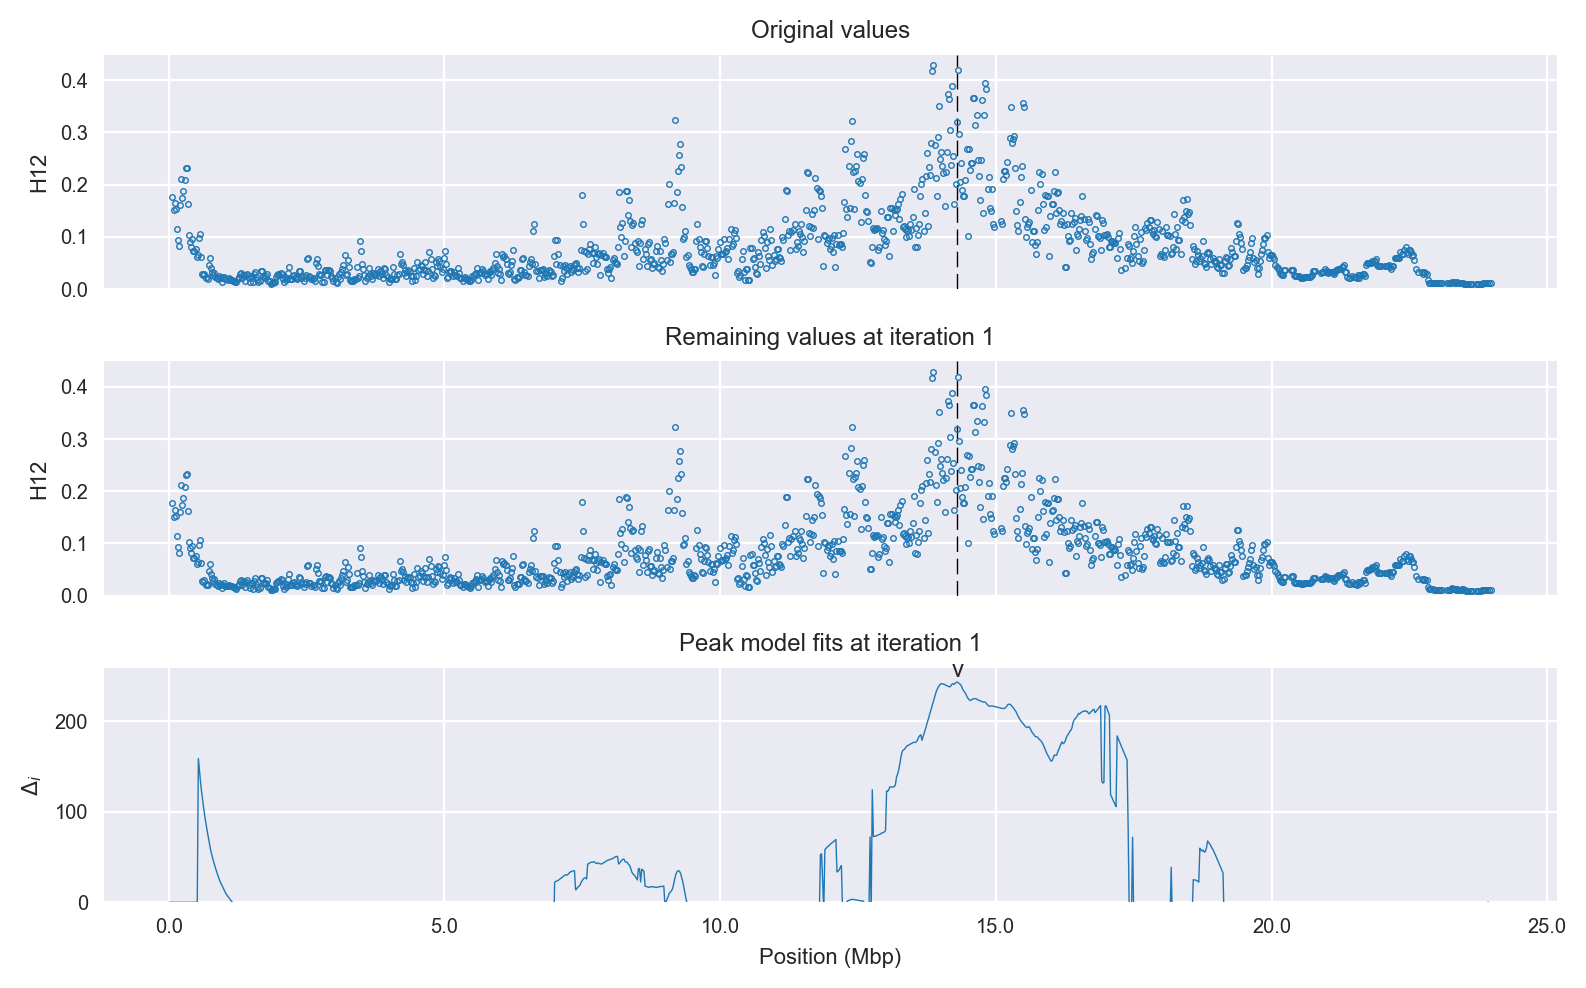
Signal location. Blue markers show the values of the selection statistic. The dashed black line shows the fitted peak model. The shaded red area shows the focus of the selection signal. The shaded blue area shows the genomic region in linkage with the selection event. Use the mouse wheel or the controls at the top right of the plot to zoom in, and hover over genes to see gene names and descriptions.
Genes
The following 19 genes overlap the focal region: AGAP000776 (myosin VI), AGAP000777, AGAP000778, AGAP000779 (zinc finger homeobox protein 1/2), AGAP0007801 (Yippee-like 5), AGAP000781 (mitochondrial import inner membrane translocase subunit Tim9), AGAP000782, AGAP000783, AGAP000784 (abhydrolase domain containing 4), AGAP000785 (Synaptic vesicle protein), AGAP000786, AGAP000787 (E3 ubiquitin-protein ligase NEDD4), AGAP000788, AGAP013147, AGAP000789, AGAP000790, AGAP000791 (Tango10), AGAP000792 (Adenosylhomocysteinase), AGAP000793.
The following 6 genes are within 50 kbp of the focal region: AGAP000772, AGAP000773 (single-minded), AGAP000774 (PH and SEC7 domain-containing protein), AGAP0007941 (NADH dehydrogenase (ubiquinone) Fe-S protein 2), AGAP013289, AGAP000795.
Key to insecticide resistance candidate gene types: 1 metabolic; 2 target-site; 3 behavioural; 4 cuticular.
Overlapping selection signals
The following selection signals have a focus which overlaps with the focus of this signal.
| Signal | Statistic | Population | Focus | Peak model |
Max. percentile | Known locus |
|---|---|---|---|---|---|---|
| XPEHH/GAS.BFS/X/1 | XPEHH | Gabon An. gambiae | X:14,040,000-14,400,000 | 250 | 99.2% | nan |
Diagnostics
The information below provides some diagnostics from the Peak modelling algorithm.
Selection signal in context. @@TODO
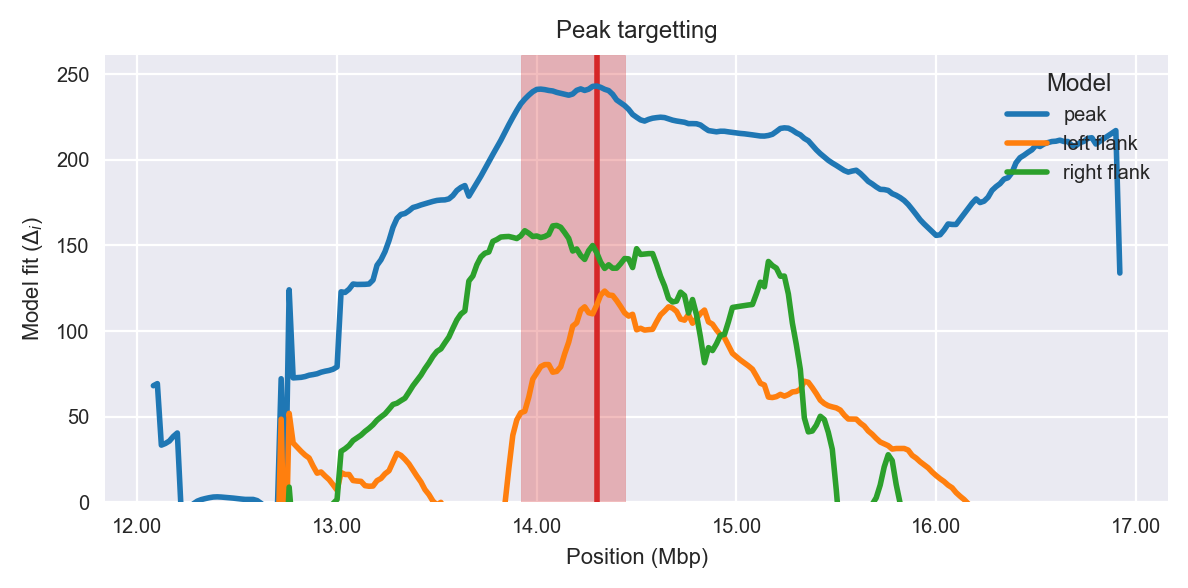
Peak targetting. @@TODO
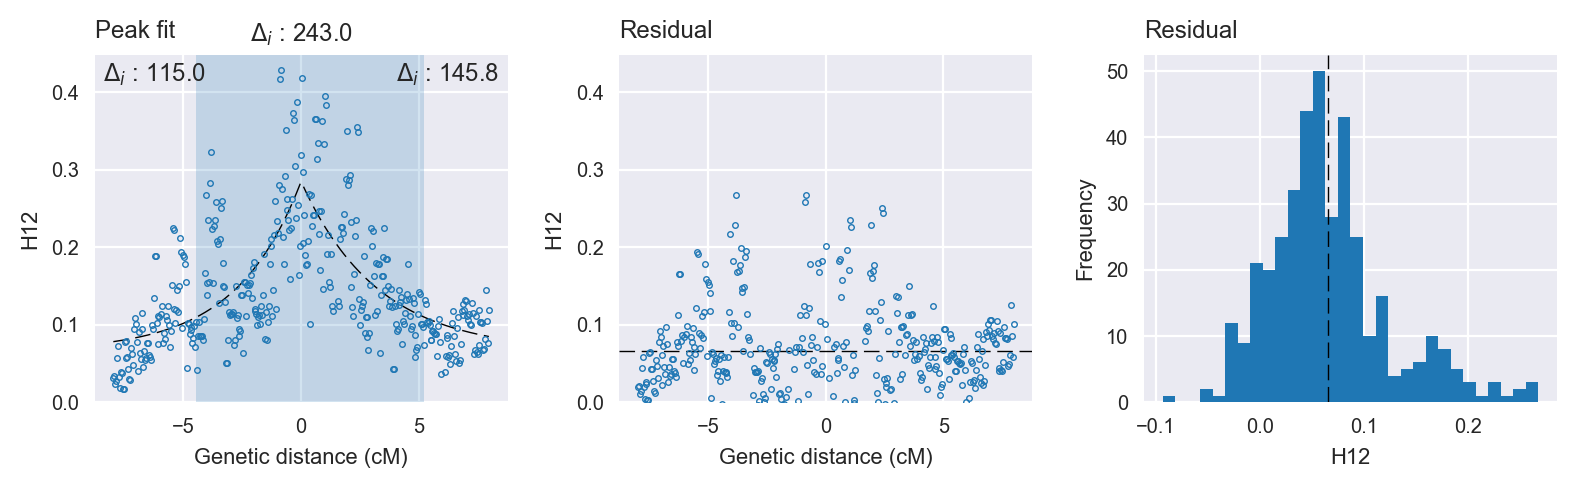
Peak fitting diagnostics. @@TODO
Model fit reports
Peak model:
[[Model]]
    Model(skewed_exponential_peak)
[[Fit Statistics]]
    # function evals   = 53
    # data points      = 390
    # variables        = 4
    chi-square         = 1.314
    reduced chi-square = 0.003
    Akaike info crit   = -2212.348
    Bayesian info crit = -2196.484
[[Variables]]
    center:      0 (fixed)
    amplitude:   0.21889434 +/- 0.012227 (5.59%) (init= 0.5)
    decay:       2.99999755 +/- 2.984731 (99.49%) (init= 0.5)
    skew:       -0.11716133 +/- 0.067429 (57.55%) (init= 0)
    baseline:    0.06593343 +/- 0.013012 (19.74%) (init= 0.03)
    ceiling:     1 (fixed)
    floor:       0 (fixed)
[[Correlations]] (unreported correlations are <  0.100)
    C(decay, baseline)           =  0.924
    C(amplitude, baseline)       = -0.589
    C(amplitude, decay)          = -0.321
Null model:
[[Model]]
    Model(constant)
[[Fit Statistics]]
    # function evals   = 12
    # data points      = 389
    # variables        = 1
    chi-square         = 2.450
    reduced chi-square = 0.006
    Akaike info crit   = -1969.317
    Bayesian info crit = -1965.353
[[Variables]]
    c:   0.14116890 +/- 0.004028 (2.85%) (init= 0.03)