H12/GWA/2/1
This page describes a signal of selection found in the
Guinea Bissau populationusing the H12 (Garud et al. 20XX) statistic.The focus of this signal is on chromosome arm
2L between positions 31,954,895 and
31,994,895.
The evidence supporting this signal is
strong ( >= 100 on both flanks).
Signal location. Blue markers show the values of the selection statistic. The dashed black line shows the fitted peak model. The shaded red area shows the focus of the selection signal. The shaded blue area shows the genomic region in linkage with the selection event. Use the mouse wheel or the controls at the top right of the plot to zoom in, and hover over genes to see gene names and descriptions.
Genes
The following 2 genes overlap the focal region: AGAP006439 (fringe), AGAP006440 (IR136 - ionotropic receptor IR136).
Gene AGAP006441 (GTP cyclohydrolase I) is within 50 kbp of the focal region.
Key to insecticide resistance candidate gene types: 1 metabolic; 2 target-site; 3 behavioural; 4 cuticular.
Overlapping selection signals
The following selection signals have a focus which overlaps with the focus of this signal.
| Signal | Statistic | Population | Focus | Peak model |
Max. percentile | Known locus |
|---|---|---|---|---|---|---|
| XPEHH/GWA.UGS/2/1 | XPEHH | Guinea Bissau | 2L:31,914,895-32,034,895 | 430 | 93.3% | nan |
| XPEHH/GWA.BFS/2/2 | XPEHH | Guinea Bissau | 2L:31,874,895-32,014,895 | 261 | 97.3% | nan |
| XPEHH/GWA.BFM/2/3 | XPEHH | Guinea Bissau | 2L:31,934,895-32,014,895 | 175 | 99.6% | nan |
Diagnostics
The information below provides some diagnostics from the Peak modelling algorithm.
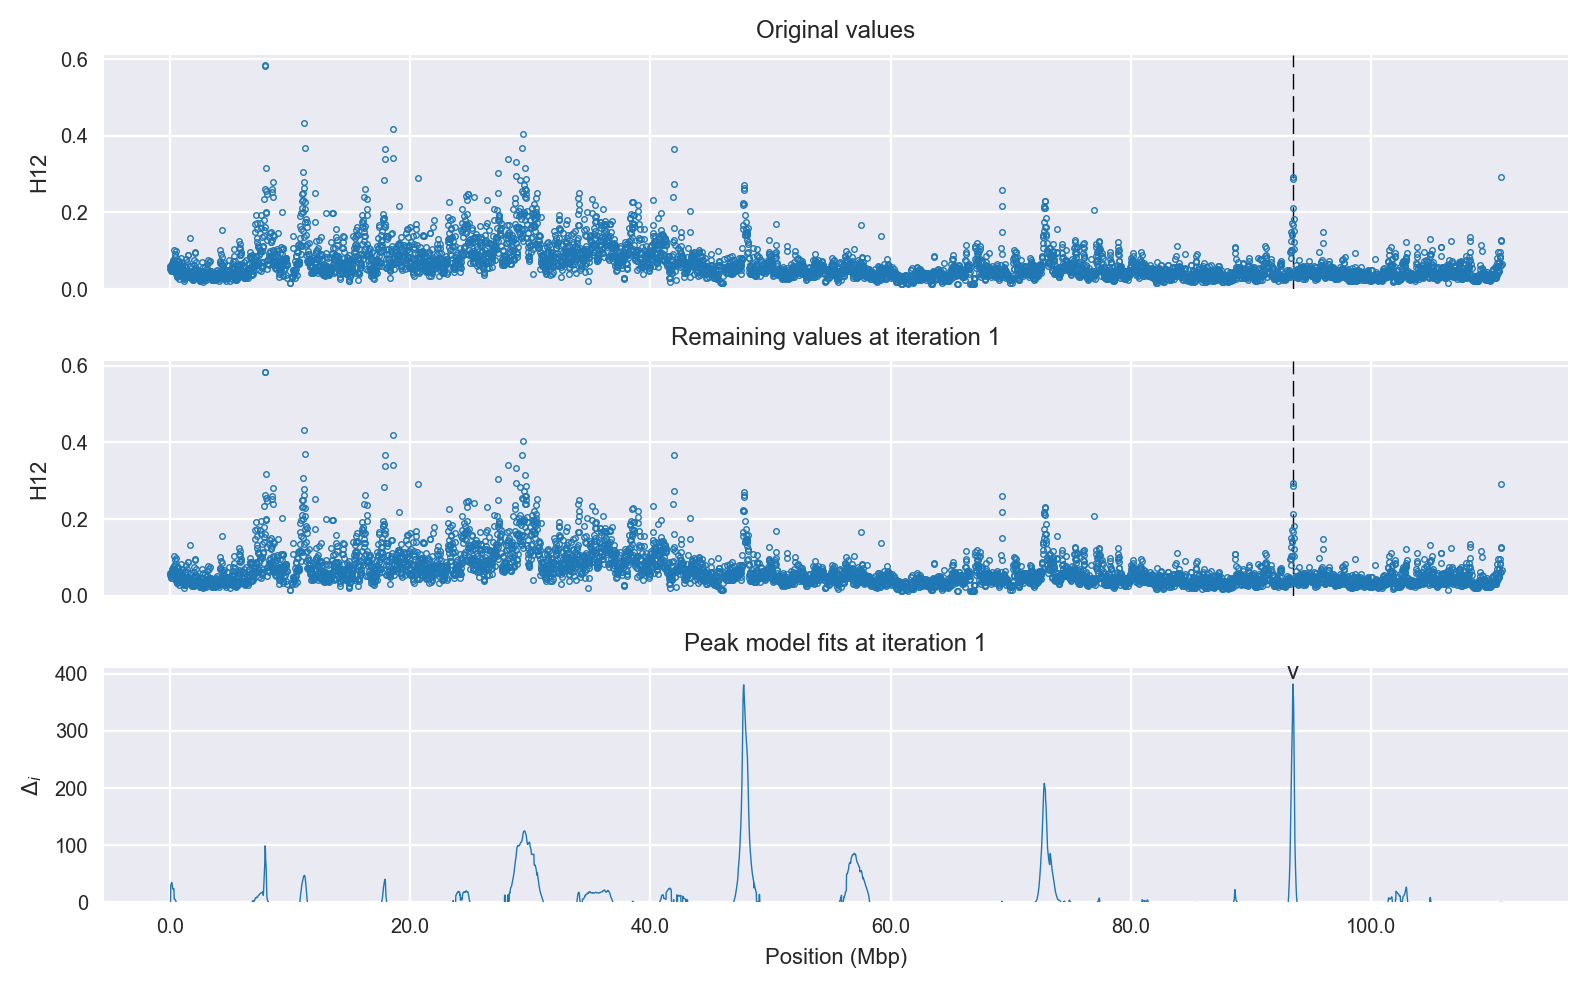
Selection signal in context. @@TODO
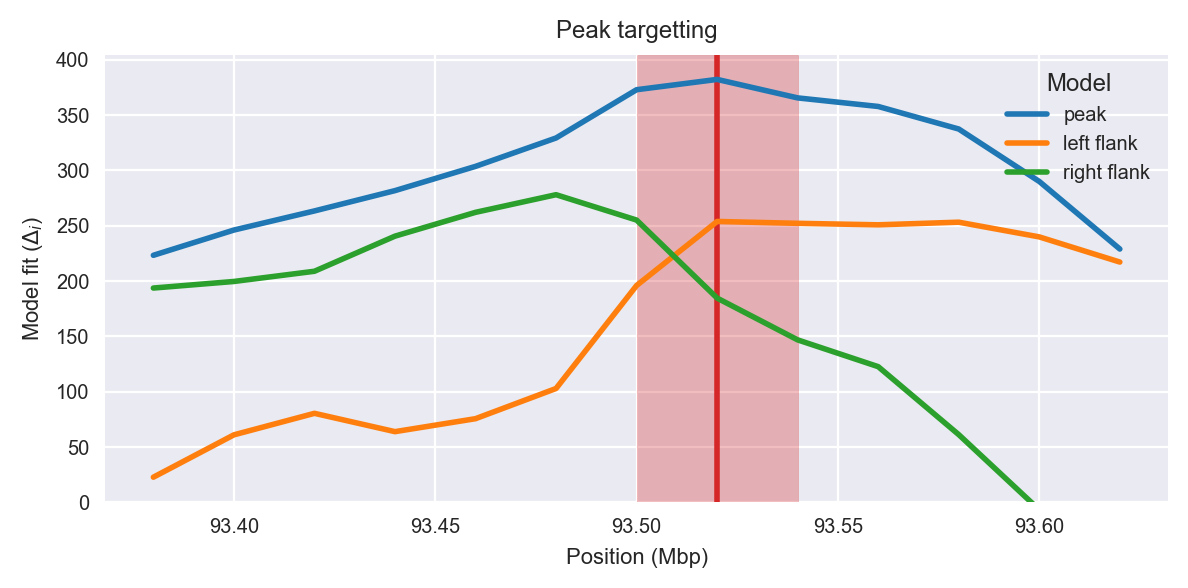
Peak targetting. @@TODO
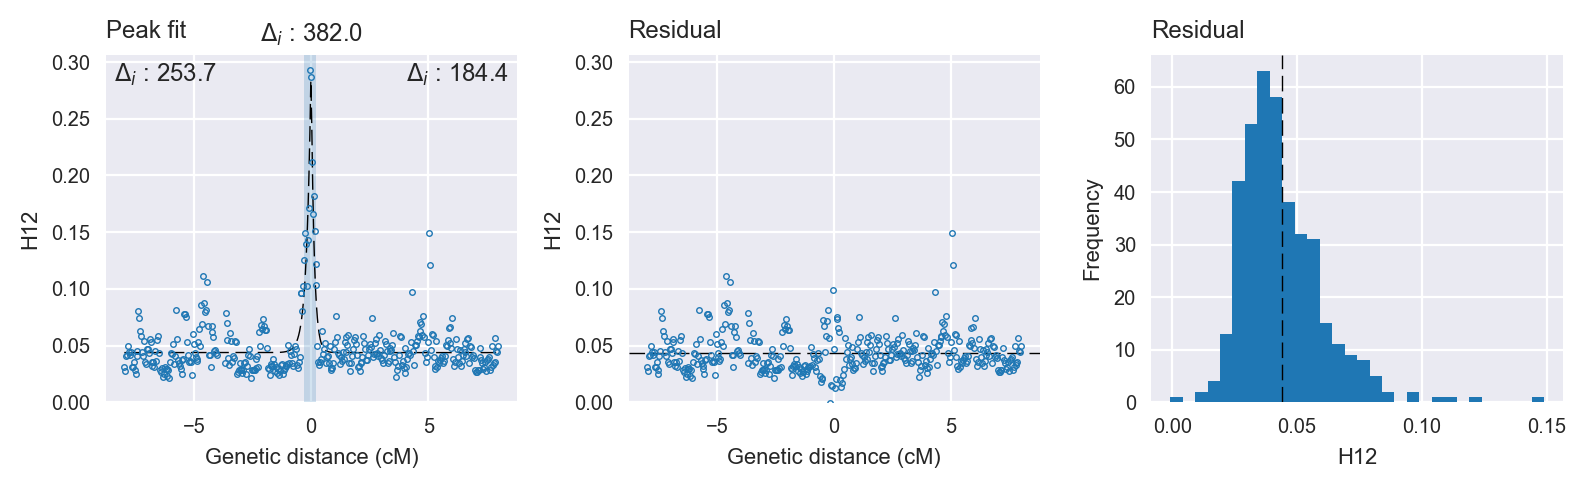
Peak fitting diagnostics. @@TODO
Model fit reports
Peak model:
[[Model]]
    Model(skewed_exponential_peak)
[[Fit Statistics]]
    # function evals   = 33
    # data points      = 393
    # variables        = 4
    chi-square         = 0.112
    reduced chi-square = 0.000
    Akaike info crit   = -3200.490
    Bayesian info crit = -3184.595
[[Variables]]
    center:      0 (fixed)
    amplitude:   0.25298218 +/- 0.012112 (4.79%) (init= 0.5)
    decay:       0.15484055 +/- 0.010777 (6.96%) (init= 0.5)
    skew:        0.28590988 +/- 0.070170 (24.54%) (init= 0)
    baseline:    0.04377143 +/- 0.000892 (2.04%) (init= 0.03)
    ceiling:     1 (fixed)
    floor:       0 (fixed)
[[Correlations]] (unreported correlations are <  0.100)
    C(amplitude, decay)          = -0.687
    C(decay, baseline)           = -0.203
    C(decay, skew)               = -0.134
Null model:
[[Model]]
    Model(constant)
[[Fit Statistics]]
    # function evals   = 11
    # data points      = 392
    # variables        = 1
    chi-square         = 0.294
    reduced chi-square = 0.001
    Akaike info crit   = -2818.473
    Bayesian info crit = -2814.502
[[Variables]]
    c:   0.04822766 +/- 0.001385 (2.87%) (init= 0.03)