H12/UGS/3/2
This page describes a signal of selection found in the
Uganda An. gambiae populationusing the H12 (Garud et al. 20XX) statistic.The focus of this signal is on chromosome arm
3R between positions 49,660,000 and
49,880,000.
The evidence supporting this signal is
strong ( >= 100 on both flanks).
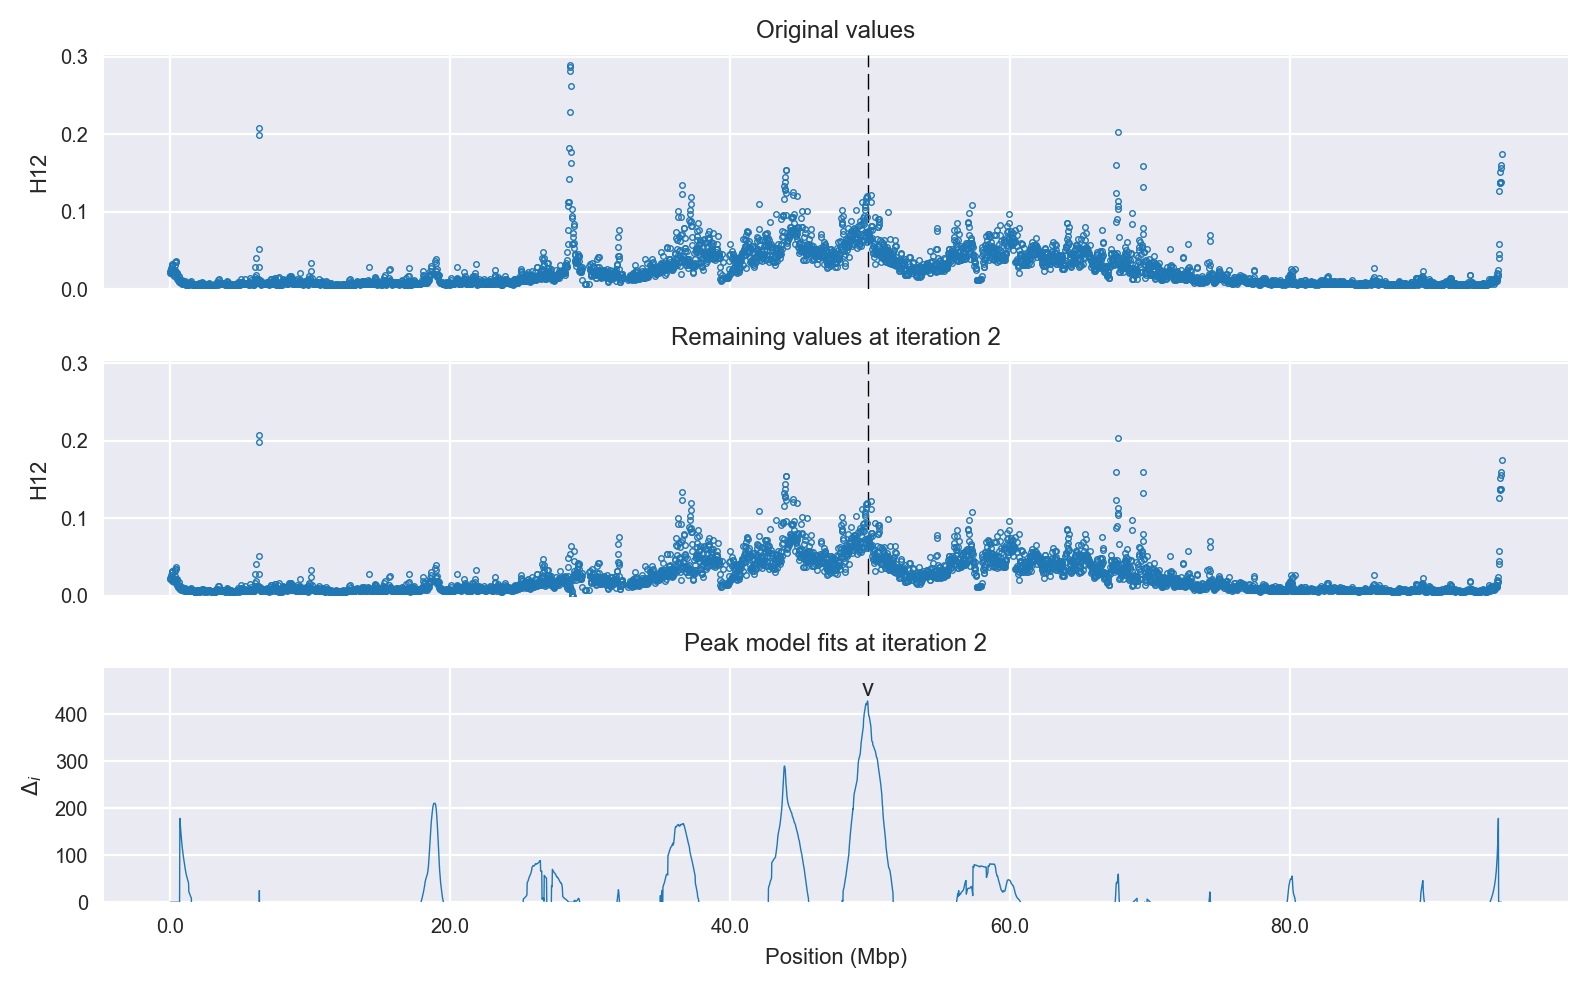
Signal location. Blue markers show the values of the selection statistic. The dashed black line shows the fitted peak model. The shaded red area shows the focus of the selection signal. The shaded blue area shows the genomic region in linkage with the selection event. Use the mouse wheel or the controls at the top right of the plot to zoom in, and hover over genes to see gene names and descriptions.
Genes
The following 12 genes overlap the focal region: AGAP010159 (dUTP pyrophosphatase), AGAP010160 (myosin I), AGAP010161, AGAP010162, AGAP010163 (RpL38 - 60S ribosomal protein L38), AGAP010164 (whd - protein withered, carnitine O-palmitoyltransferase), AGAP010165 (dynein light intermediate chain 2, cytosolic), AGAP010166, AGAP010167 (numb), AGAP010168, AGAP0101692, AGAP0280322.
The following 9 genes are within 50 kbp of the focal region: AGAP010158, AGAP010170, AGAP010171 (papi - TUDOR-domain protein), AGAP013768, AGAP010172 (protein phosphatase 2 (formerly 2A), catalytic subunit), AGAP010173 (Rack1 - guanine nucleotide-binding protein subunit beta-like protein), AGAP010174 (oligosaccharyltransferase complex subunit alpha (ribophorin I)), AGAP010175 (adenylyl cyclase-associated protein 1), AGAP010176.
Key to insecticide resistance candidate gene types: 1 metabolic; 2 target-site; 3 behavioural; 4 cuticular.
Overlapping selection signals
The following selection signals have a focus which overlaps with the focus of this signal.
| Signal | Statistic | Population | Focus | Peak model |
Max. percentile | Known locus |
|---|---|---|---|---|---|---|
| XPEHH/UGS.BFS/3/5 | XPEHH | Uganda An. gambiae | 3R:49,540,000-49,660,000 | 93 | 98.9% | nan |
Diagnostics
The information below provides some diagnostics from the Peak modelling algorithm.
Selection signal in context. @@TODO
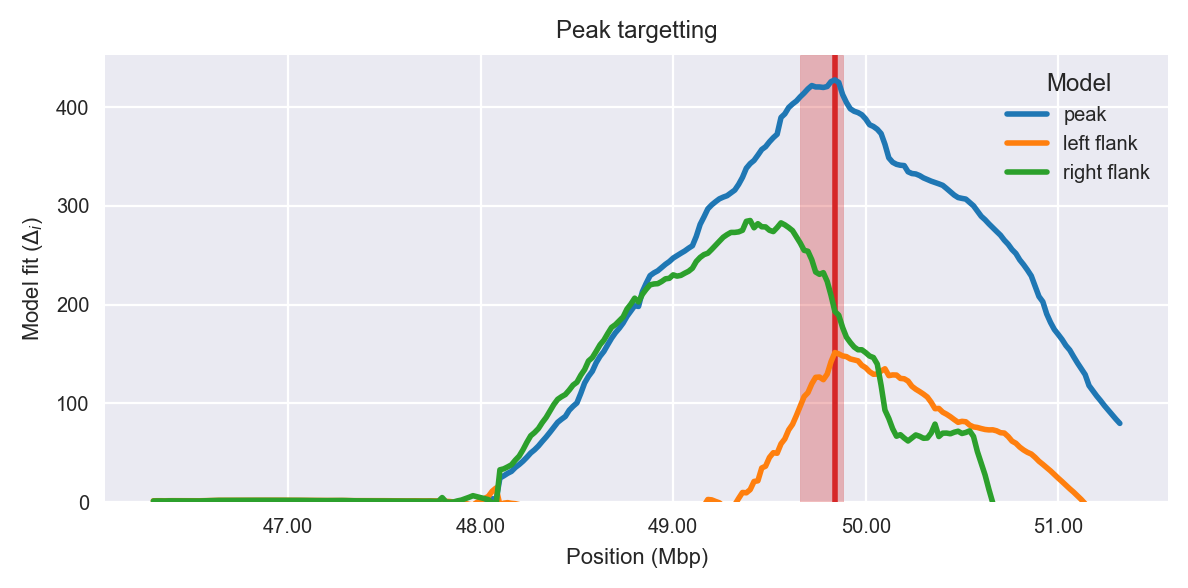
Peak targetting. @@TODO
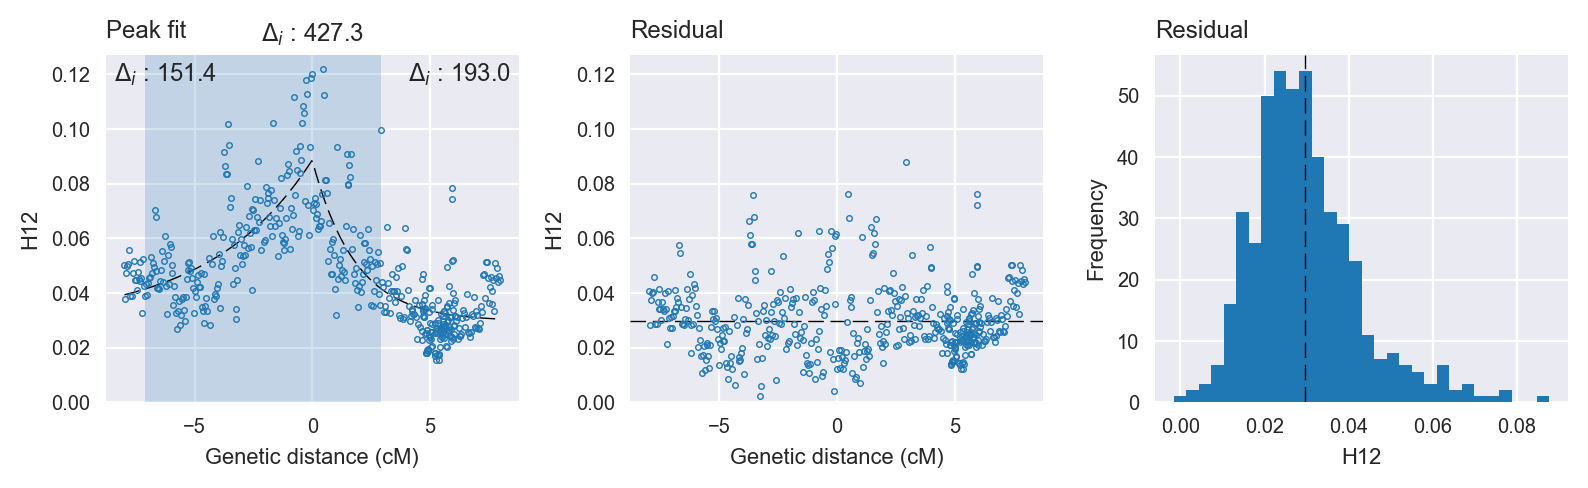
Peak fitting diagnostics. @@TODO
Model fit reports
Peak model:
[[Model]]
    Model(skewed_exponential_peak)
[[Fit Statistics]]
    # function evals   = 43
    # data points      = 473
    # variables        = 4
    chi-square         = 0.078
    reduced chi-square = 0.000
    Akaike info crit   = -4109.529
    Bayesian info crit = -4092.893
[[Variables]]
    center:      0 (fixed)
    amplitude:   0.05891882 +/- 0.002324 (3.94%) (init= 0.5)
    decay:       2.83391207 +/- 0.293192 (10.35%) (init= 0.5)
    skew:        0.63596717 +/- 0.062567 (9.84%) (init= 0)
    baseline:    0.02968130 +/- 0.001665 (5.61%) (init= 0.03)
    ceiling:     1 (fixed)
    floor:       0 (fixed)
[[Correlations]] (unreported correlations are <  0.100)
    C(decay, baseline)           = -0.842
    C(skew, baseline)            =  0.395
    C(amplitude, baseline)       = -0.346
    C(decay, skew)               = -0.337
    C(amplitude, skew)           = -0.270
Null model:
[[Model]]
    Model(constant)
[[Fit Statistics]]
    # function evals   = 11
    # data points      = 472
    # variables        = 1
    chi-square         = 0.192
    reduced chi-square = 0.000
    Akaike info crit   = -3682.247
    Bayesian info crit = -3678.090
[[Variables]]
    c:   0.04678610 +/- 0.000930 (1.99%) (init= 0.03)