XPEHH/UGS.BFS/3/5
This page describes a signal of selection found in the
Uganda An. gambiae population
when compared with the Burkina Faso An. gambiae population
using the XPEHH (Cite et al. 20XX) statistic.The focus of this signal is on chromosome arm
3R between positions 49,540,000 and
49,660,000.
The evidence supporting this signal is
moderate ( >= 50 on both flanks).
Signal location. Blue markers show the values of the selection statistic. The dashed black line shows the fitted peak model. The shaded red area shows the focus of the selection signal. The shaded blue area shows the genomic region in linkage with the selection event. Use the mouse wheel or the controls at the top right of the plot to zoom in, and hover over genes to see gene names and descriptions.
Genes
The following 5 genes overlap the focal region: AGAP013739, AGAP010156 (ATP citrate lyase), AGAP013762, AGAP010157 (Ast2 - allatostatin 2), AGAP010158.
The following 8 genes are within 50 kbp of the focal region: AGAP010149 (cytochrome b5-related), AGAP0101501 (cytochrome b5-related), AGAP010151, AGAP010152 (gem associated protein 5), AGAP010155, AGAP010159 (dUTP pyrophosphatase), AGAP010160 (myosin I), AGAP010161.
Key to insecticide resistance candidate gene types: 1 metabolic; 2 target-site; 3 behavioural; 4 cuticular.
Overlapping selection signals
The following selection signals have a focus which overlaps with the focus of this signal.
| Signal | Statistic | Population | Focus | Peak model |
Max. percentile | Known locus |
|---|---|---|---|---|---|---|
| H12/UGS/3/2 | H12 | Uganda An. gambiae | 3R:49,660,000-49,880,000 | 427 | 93.3% | nan |
| H12/GWA/3/1 | H12 | Guinea Bissau | 3R:49,480,000-49,620,000 | 165 | 93.8% | nan |
Diagnostics
The information below provides some diagnostics from the Peak modelling algorithm.
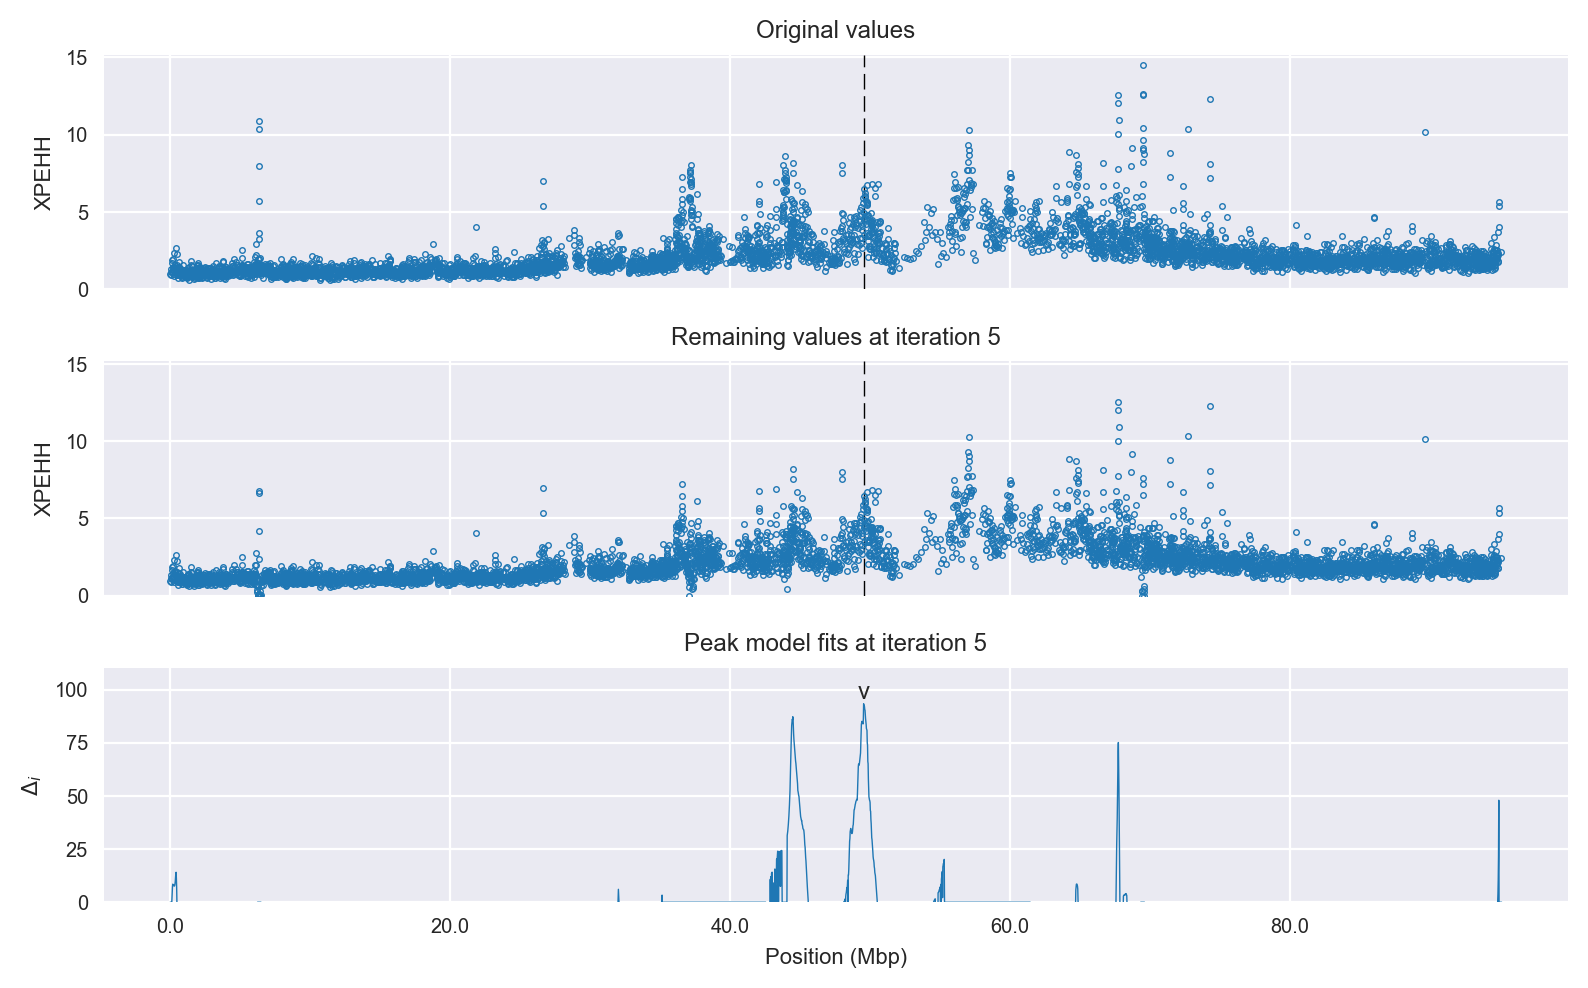
Selection signal in context. @@TODO
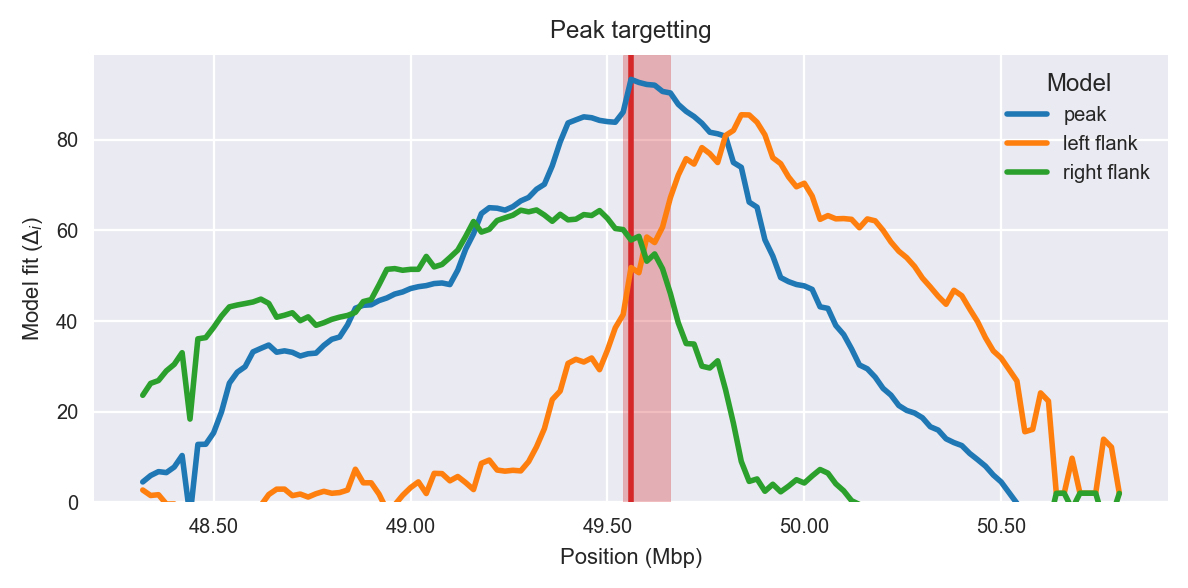
Peak targetting. @@TODO
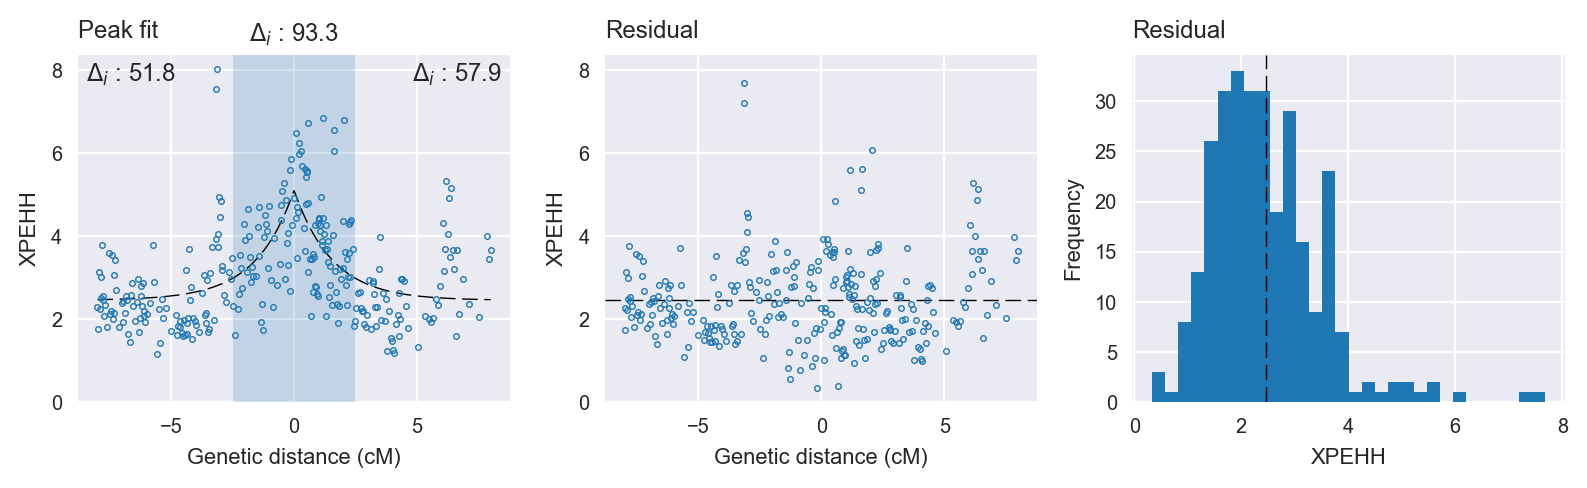
Peak fitting diagnostics. @@TODO
Model fit reports
Peak model:
[[Model]]
    Model(skewed_exponential_peak)
[[Fit Statistics]]
    # function evals   = 38
    # data points      = 294
    # variables        = 4
    chi-square         = 310.138
    reduced chi-square = 1.069
    Akaike info crit   = 23.711
    Bayesian info crit = 38.445
[[Variables]]
    center:      0 (fixed)
    amplitude:   2.65141422 +/- 0.242118 (9.13%) (init= 3)
    decay:       1.54995334 +/- 0.322812 (20.83%) (init= 0.5)
    skew:        0.00080005 +/- 0.139208 (17399.94%) (init= 0)
    baseline:    2.45517662 +/- 0.125477 (5.11%) (init= 1)
    ceiling:     100 (fixed)
    floor:       0 (fixed)
[[Correlations]] (unreported correlations are <  0.100)
    C(decay, baseline)           = -0.753
    C(amplitude, decay)          = -0.344
    C(amplitude, baseline)       = -0.162
    C(decay, skew)               =  0.127
    C(skew, baseline)            = -0.111
Null model:
[[Model]]
    Model(constant)
[[Fit Statistics]]
    # function evals   = 11
    # data points      = 293
    # variables        = 1
    chi-square         = 433.901
    reduced chi-square = 1.486
    Akaike info crit   = 117.044
    Bayesian info crit = 120.725
[[Variables]]
    c:   3.10251982 +/- 0.071210 (2.30%) (init= 1)