IHS/BFS/3/2
This page describes a signal of selection found in the
Burkina Faso An. gambiae populationusing the IHS (Cite et al. 20XX) statistic.The focus of this signal is on chromosome arm
3R between positions 4,340,000 and
4,740,000.
The evidence supporting this signal is
strong ( >= 100 on both flanks).
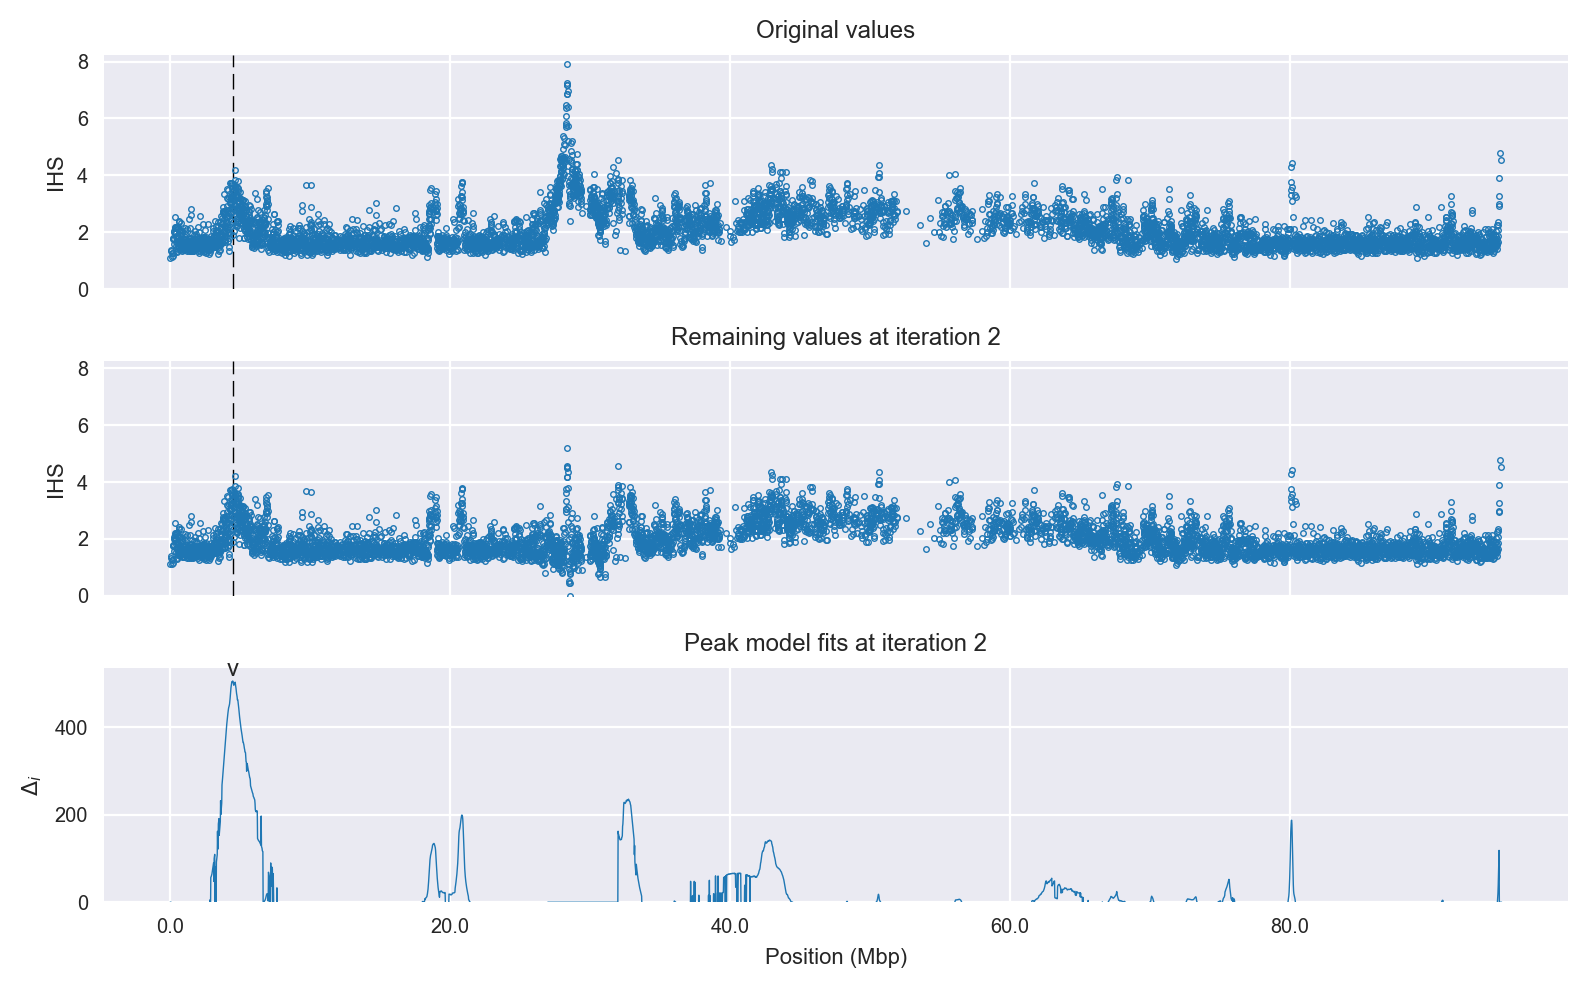
Signal location. Blue markers show the values of the selection statistic. The dashed black line shows the fitted peak model. The shaded red area shows the focus of the selection signal. The shaded blue area shows the genomic region in linkage with the selection event. Use the mouse wheel or the controls at the top right of the plot to zoom in, and hover over genes to see gene names and descriptions.
Genes
The following 7 genes overlap the focal region: AGAP008023 (en - segmentation polarity homeobox protein engrailed), AGAP008025 (Homeobox protein engrailed-like), AGAP013728, AGAP008026 (enhancer of polycomb-like protein), AGAP008027 (Slowmo), AGAP008028 (voltage-dependent calcium channel beta, invertebrate), AGAP028427.
The following 10 genes are within 50 kbp of the focal region: AGAP0080181 (CYP12F4 - cytochrome P450), AGAP0080191 (CYP12F3 - cytochrome P450), AGAP0080201 (CYP12F2 - cytochrome P450), AGAP0080221 (CYP12F1 - cytochrome P450), AGAP008033, AGAP013760, AGAP008034 (solute carrier family 39 (zinc transporter), member 7), AGAP008035, AGAP008036, AGAP008037 (KDEL (Lys-Asp-Glu-Leu) containing 1, isoform CRA_a).
Key to insecticide resistance candidate gene types: 1 metabolic; 2 target-site; 3 behavioural; 4 cuticular.
Overlapping selection signals
The following selection signals have a focus which overlaps with the focus of this signal.
| Signal | Statistic | Population | Focus | Peak model |
Max. percentile | Known locus |
|---|---|---|---|---|---|---|
| IHS/GNS/3/2 | IHS | Guinea An. gambiae | 3R:4,400,000-4,960,000 | 508 | 99.0% | nan |
| H12/GNS/3/2 | H12 | Guinea An. gambiae | 3R:4,600,000-5,060,000 | 253 | 77.2% | nan |
| XPEHH/CMS.GAS/3/3 | XPEHH | Cameroon An. gambiae | 3R:4,300,000-4,380,000 | 127 | 93.6% | nan |
Diagnostics
The information below provides some diagnostics from the Peak modelling algorithm.
Selection signal in context. @@TODO
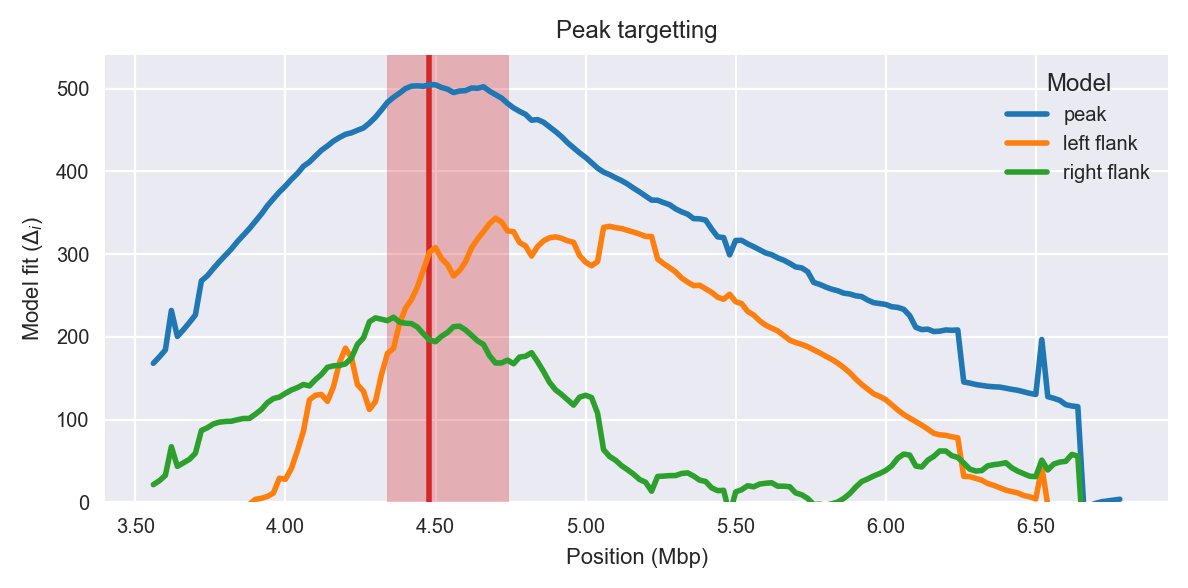
Peak targetting. @@TODO
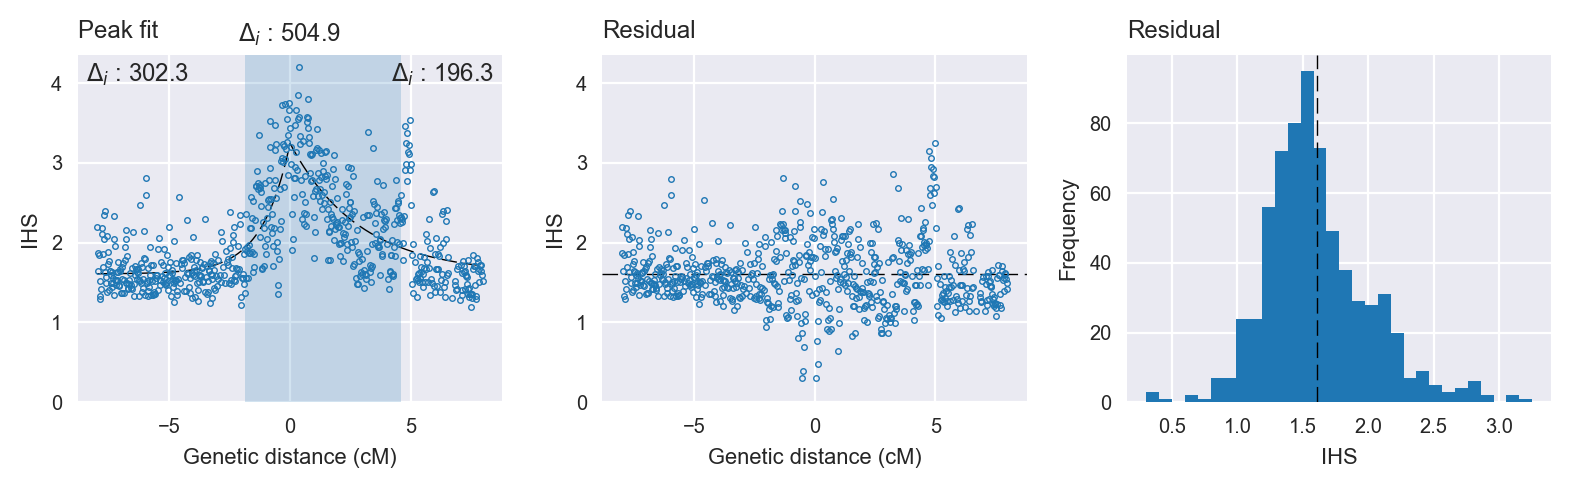
Peak fitting diagnostics. @@TODO
Model fit reports
Peak model:
[[Model]]
    Model(skewed_exponential_peak)
[[Fit Statistics]]
    # function evals   = 33
    # data points      = 679
    # variables        = 4
    chi-square         = 110.581
    reduced chi-square = 0.164
    Akaike info crit   = -1224.297
    Bayesian info crit = -1206.214
[[Variables]]
    center:      0 (fixed)
    amplitude:   1.63509416 +/- 0.063148 (3.86%) (init= 3)
    decay:       1.82458115 +/- 0.153090 (8.39%) (init= 0.5)
    skew:       -0.65270722 +/- 0.061285 (9.39%) (init= 0)
    baseline:    1.60753304 +/- 0.030606 (1.90%) (init= 1)
    ceiling:     100 (fixed)
    floor:       0 (fixed)
[[Correlations]] (unreported correlations are <  0.100)
    C(decay, baseline)           = -0.716
    C(amplitude, decay)          = -0.346
    C(decay, skew)               =  0.266
    C(amplitude, baseline)       = -0.185
    C(skew, baseline)            = -0.135
Null model:
[[Model]]
    Model(constant)
[[Fit Statistics]]
    # function evals   = 11
    # data points      = 678
    # variables        = 1
    chi-square         = 233.967
    reduced chi-square = 0.346
    Akaike info crit   = -719.370
    Bayesian info crit = -714.851
[[Variables]]
    c:   2.01228416 +/- 0.022577 (1.12%) (init= 1)