IHS/CMS/2/7
This page describes a signal of selection found in the
Cameroon An. gambiae populationusing the IHS (Cite et al. 20XX) statistic.The focus of this signal is on chromosome arm
2L between positions 46,054,895 and
46,094,895.
The evidence supporting this signal is
weak ( < 50 on one or both flanks).
Signal location. Blue markers show the values of the selection statistic. The dashed black line shows the fitted peak model. The shaded red area shows the focus of the selection signal. The shaded blue area shows the genomic region in linkage with the selection event. Use the mouse wheel or the controls at the top right of the plot to zoom in, and hover over genes to see gene names and descriptions.
Genes
The following 6 genes overlap the focal region: AGAP007361 (translocation protein SEC63), AGAP007362 (SH3 domain-binding glutamic acid-rich-like protein 3), AGAP007363, AGAP007364, AGAP007365, AGAP007366.
The following 14 genes are within 50 kbp of the focal region: AGAP007353 (phosphatidylinositol transfer protein SEC14), AGAP007354 (phosphatidylinositol transfer protein SEC14), AGAP007355 (cellular retinaldehyde binding protein), AGAP007356 (cellular retinaldehyde binding protein), AGAP007357 (retinaldehyde-binding protein 1-like protein 1), AGAP007358 (cellular retinaldehyde binding protein), AGAP007359, AGAP007367 (solute carrier family 6 (neurotransmitter transporter, dopamine) member 3), AGAP007368, AGAP007369 (Ras-related protein Rap-1b precursor), AGAP007370, AGAP007371, AGAP007372, AGAP007373 (Tetraspanin).
Key to insecticide resistance candidate gene types: 1 metabolic; 2 target-site; 3 behavioural; 4 cuticular.
Overlapping selection signals
The following selection signals have a focus which overlaps with the focus of this signal.
| Signal | Statistic | Population | Focus | Peak model |
Max. percentile | Known locus |
|---|---|---|---|---|---|---|
| IHS/BFS/2/6 | IHS | Burkina Faso An. gambiae | 2L:46,034,895-46,214,895 | 221 | 96.2% | nan |
Diagnostics
The information below provides some diagnostics from the Peak modelling algorithm.
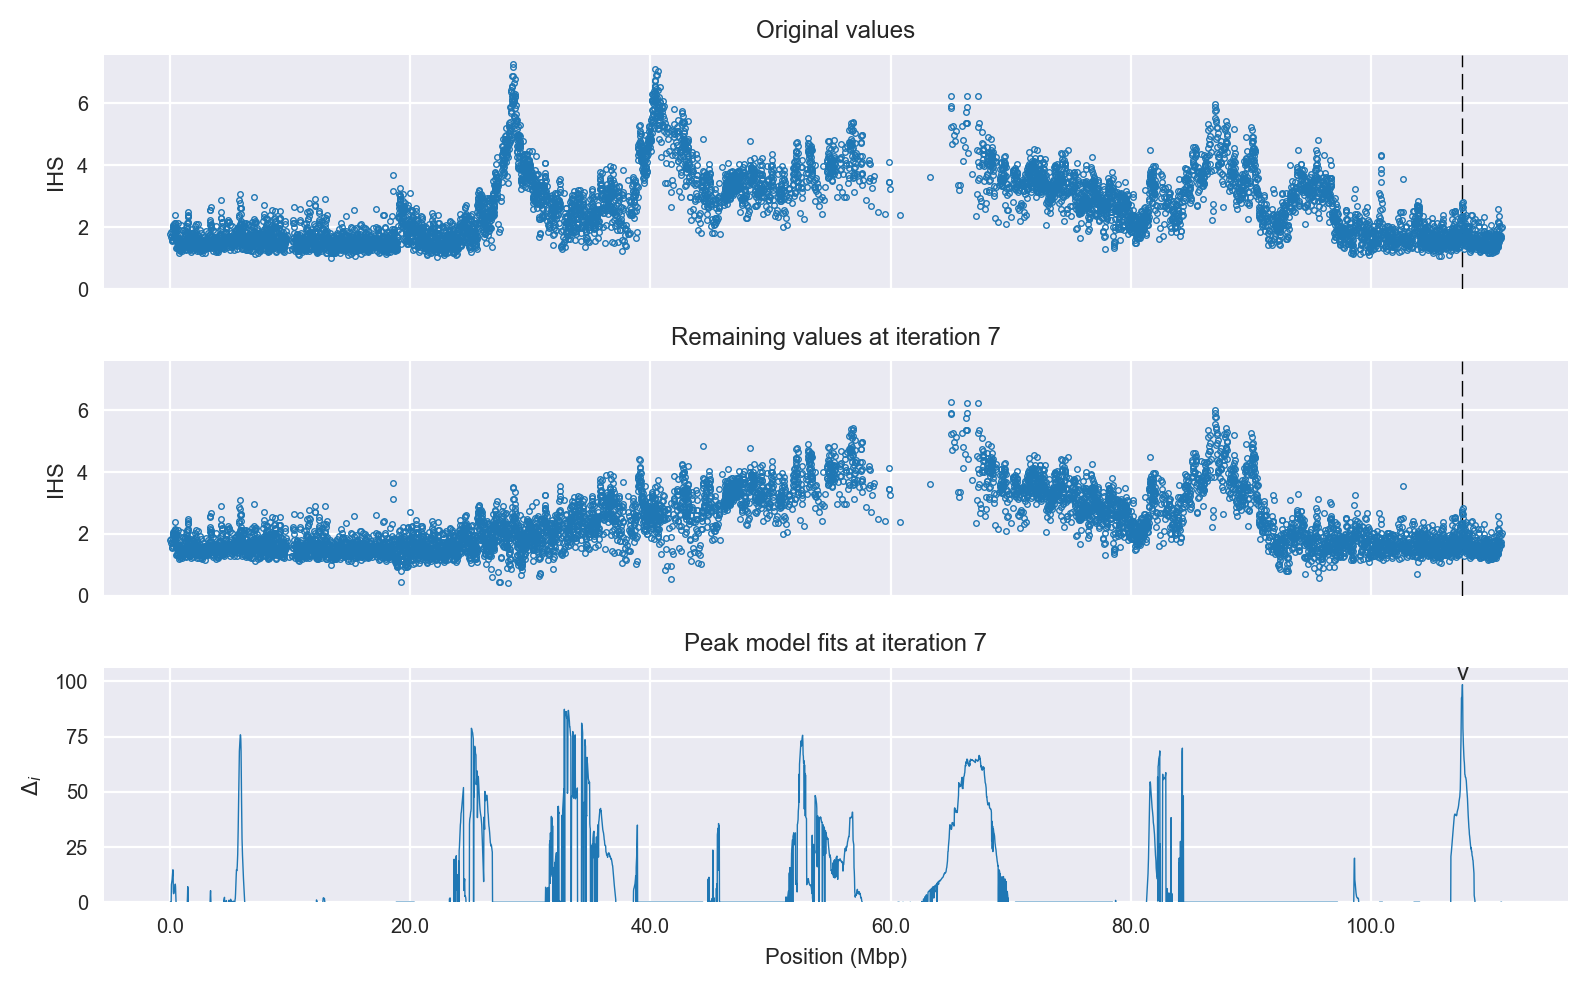
Selection signal in context. @@TODO
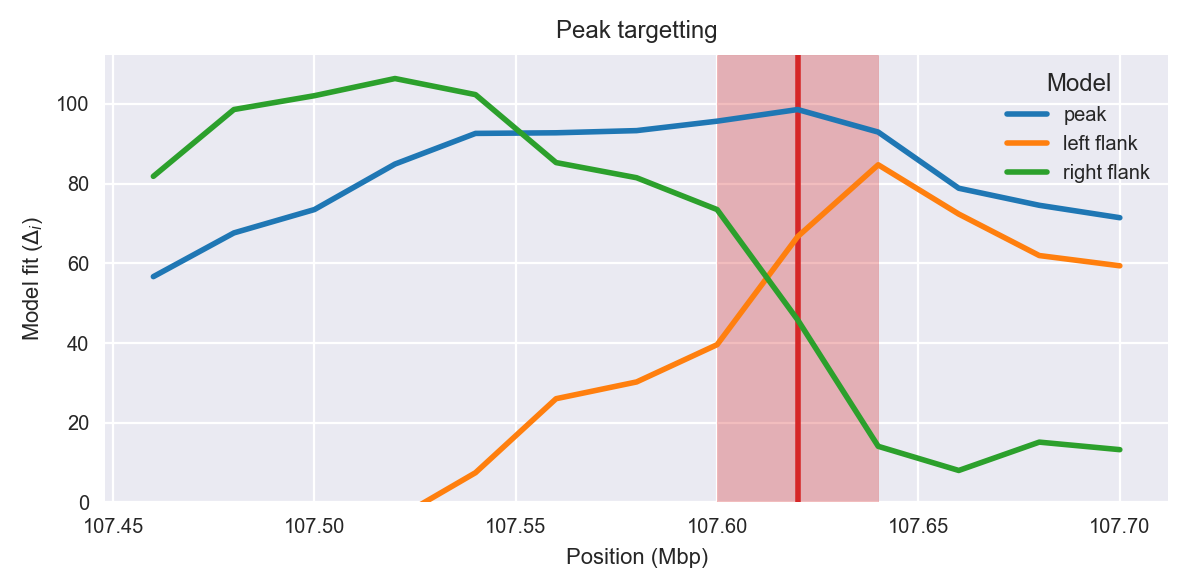
Peak targetting. @@TODO
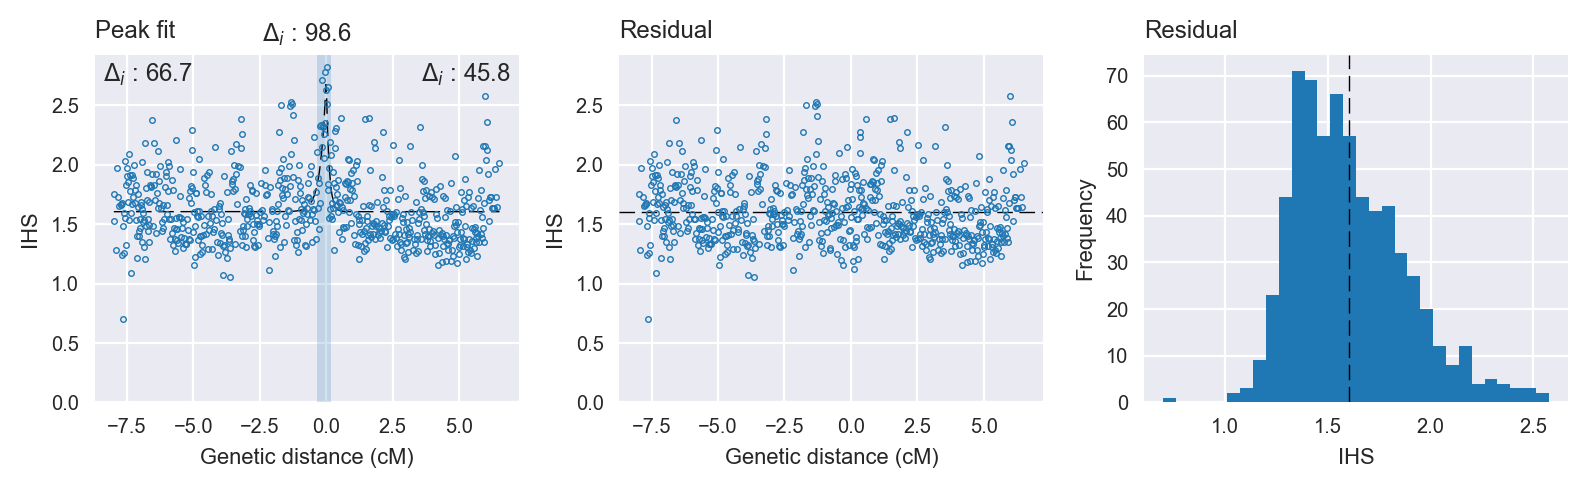
Peak fitting diagnostics. @@TODO
Model fit reports
Peak model:
[[Model]]
    Model(skewed_exponential_peak)
[[Fit Statistics]]
    # function evals   = 70
    # data points      = 661
    # variables        = 4
    chi-square         = 49.013
    reduced chi-square = 0.075
    Akaike info crit   = -1711.707
    Bayesian info crit = -1693.732
[[Variables]]
    center:      0 (fixed)
    amplitude:   1.12085747 +/- 0.139081 (12.41%) (init= 3)
    decay:       0.15000040 +/- 0.013910 (9.27%) (init= 0.5)
    skew:        0.50836283 +/- 0.182545 (35.91%) (init= 0)
    baseline:    1.60522644 +/- 0.011168 (0.70%) (init= 1)
    ceiling:     100 (fixed)
    floor:       0 (fixed)
[[Correlations]] (unreported correlations are <  0.100)
    C(amplitude, decay)          =  0.690
    C(decay, baseline)           =  0.220
    C(decay, skew)               =  0.146
Null model:
[[Model]]
    Model(constant)
[[Fit Statistics]]
    # function evals   = 11
    # data points      = 660
    # variables        = 1
    chi-square         = 57.114
    reduced chi-square = 0.087
    Akaike info crit   = -1613.145
    Bayesian info crit = -1608.652
[[Variables]]
    c:   1.63033405 +/- 0.011459 (0.70%) (init= 1)