IHS/GNS/2/3
This page describes a signal of selection found in the
Guinea An. gambiae populationusing the IHS (Cite et al. 20XX) statistic.The focus of this signal is on chromosome arm
2R between positions 40,200,000 and
40,420,000.
The evidence supporting this signal is
strong ( >= 100 on both flanks).
Signal location. Blue markers show the values of the selection statistic. The dashed black line shows the fitted peak model. The shaded red area shows the focus of the selection signal. The shaded blue area shows the genomic region in linkage with the selection event. Use the mouse wheel or the controls at the top right of the plot to zoom in, and hover over genes to see gene names and descriptions.
Genes
The following 23 genes overlap the focal region: AGAP003579 (cadherin-87A), AGAP003580, AGAP0035811 (D-xylulose reductase A), AGAP0035821 (D-xylulose reductase A), AGAP0035831 (L-iditol 2-dehydrogenase), AGAP0035841 (L-iditol 2-dehydrogenase), AGAP003585, AGAP003586 (Phosphate carrier, mitochondrial), AGAP013333 (Phosphate carrier, mitochondrial), AGAP003587 (solute carrier family 26 (sodium-independent sulfate anion transporter)), AGAP003588 (VATH - V-type H -transporting ATPase subunit H), AGAP003589 (prolyl-tRNA synthetase), AGAP003590, AGAP003591 (LRR-repeat protein 1), AGAP003592 (RpLP0 - 60S ribosomal protein LP0), AGAP003593 (Protein arginine methyltransferase RmtB), AGAP003594, AGAP003595 (rRNA biogenesis protein RRP5), AGAP003596, AGAP003597 (histone-lysine N-methyltransferase SUV39H), AGAP003598 (template-activating factor I), AGAP003599 (F-type H -transporting ATPase oligomycin sensitivity conferral protein), AGAP003600 (Elongation of very long chain fatty acids protein).
The following 7 genes are within 50 kbp of the focal region: AGAP0035781 (aldehyde dehydrogenase (NAD )), AGAP003601 (alpha-1,2-mannosyltransferase), AGAP003602 (methyltransferase-like protein 9), AGAP003603, AGAP003604, AGAP003605 (cullin 2), AGAP003606 (Fatty acyl-CoA reductase).
Key to insecticide resistance candidate gene types: 1 metabolic; 2 target-site; 3 behavioural; 4 cuticular.
Overlapping selection signals
The following selection signals have a focus which overlaps with the focus of this signal.
| Signal | Statistic | Population | Focus | Peak model |
Max. percentile | Known locus |
|---|---|---|---|---|---|---|
| IHS/CMS/2/2 | IHS | Cameroon An. gambiae | 2R:40,060,000-40,780,000 | 643 | 100.0% | nan |
| IHS/BFS/2/3 | IHS | Burkina Faso An. gambiae | 2R:40,320,000-40,560,000 | 557 | 99.5% | nan |
| H12/CMS/2/3 | H12 | Cameroon An. gambiae | 2R:40,300,000-40,740,000 | 501 | 98.7% | nan |
| IHS/UGS/2/5 | IHS | Uganda An. gambiae | 2R:40,160,000-40,200,000 | 132 | 98.3% | nan |
Diagnostics
The information below provides some diagnostics from the Peak modelling algorithm.
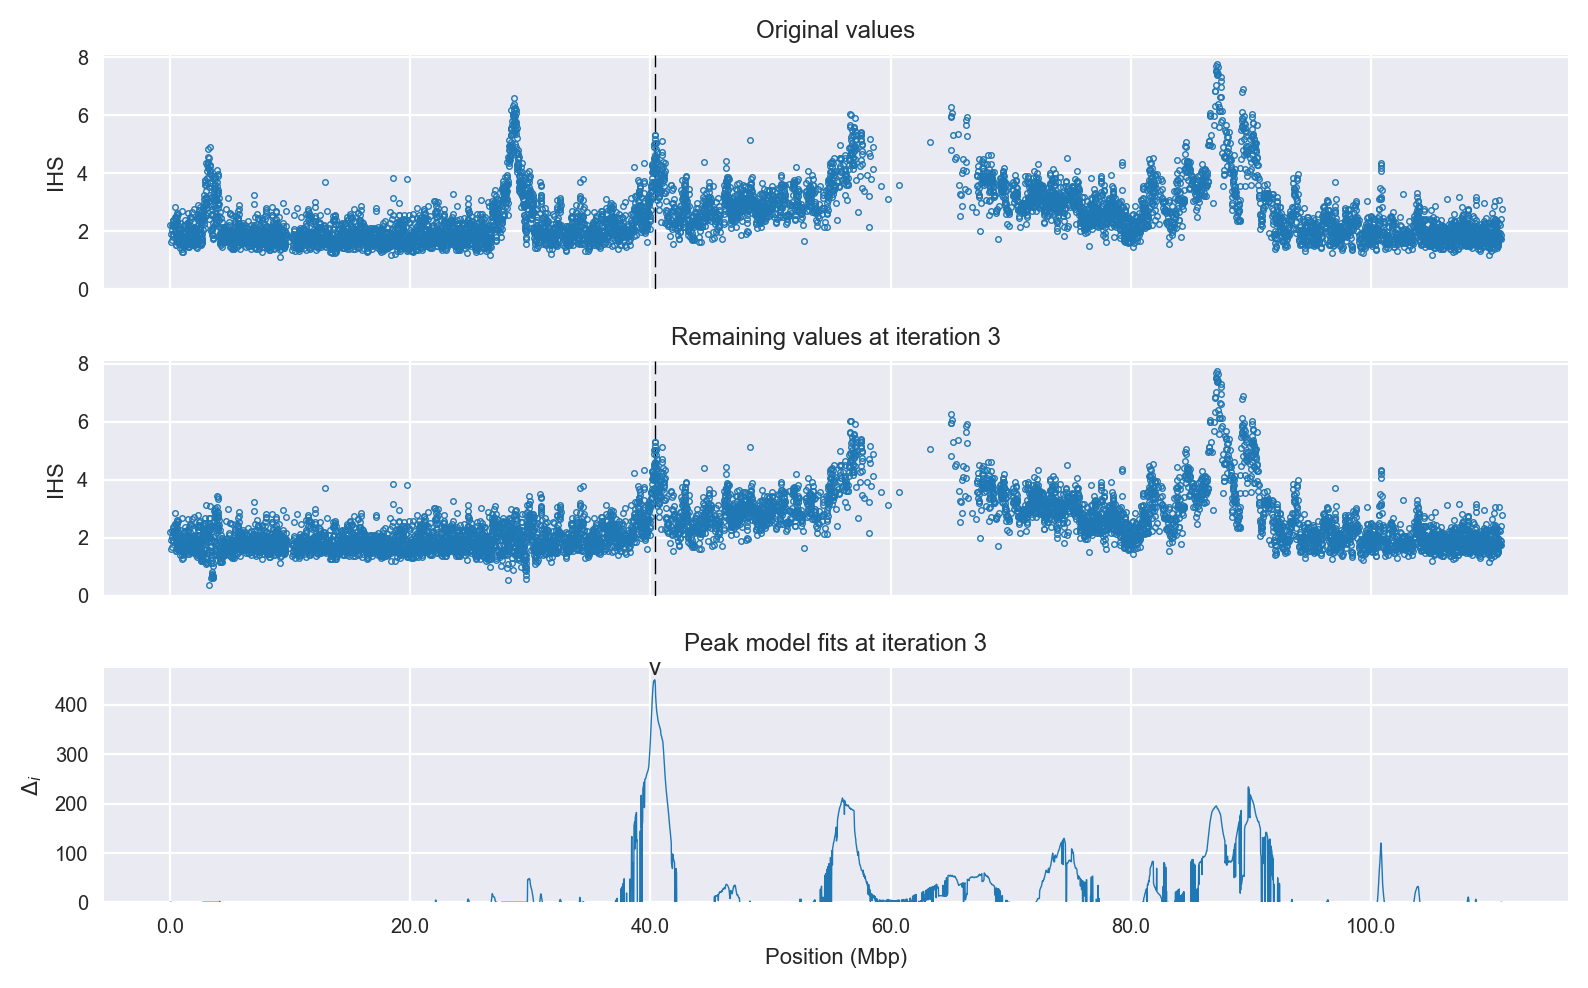
Selection signal in context. @@TODO
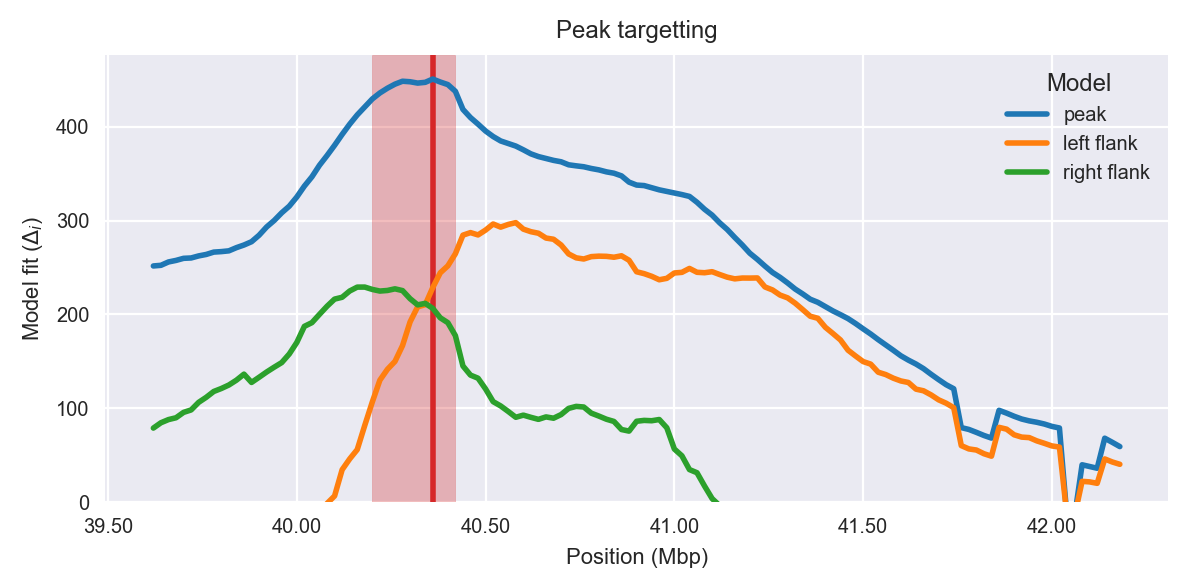
Peak targetting. @@TODO
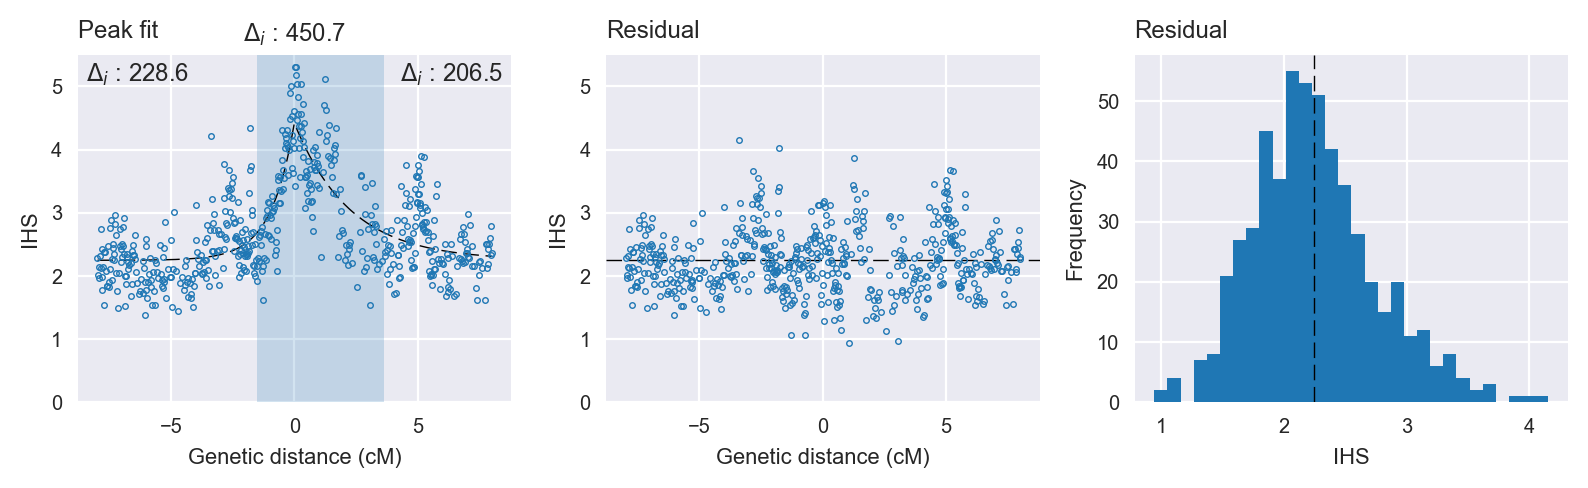
Peak fitting diagnostics. @@TODO
Model fit reports
Peak model:
[[Model]]
    Model(skewed_exponential_peak)
[[Fit Statistics]]
    # function evals   = 48
    # data points      = 549
    # variables        = 4
    chi-square         = 141.163
    reduced chi-square = 0.259
    Akaike info crit   = -737.642
    Bayesian info crit = -720.410
[[Variables]]
    center:      0 (fixed)
    amplitude:   2.17339499 +/- 0.085659 (3.94%) (init= 3)
    decay:       1.45937367 +/- 0.126864 (8.69%) (init= 0.5)
    skew:       -0.63477604 +/- 0.067673 (10.66%) (init= 0)
    baseline:    2.24720608 +/- 0.039143 (1.74%) (init= 1)
    ceiling:     100 (fixed)
    floor:       0 (fixed)
[[Correlations]] (unreported correlations are <  0.100)
    C(decay, baseline)           = -0.703
    C(amplitude, decay)          = -0.333
    C(amplitude, baseline)       = -0.175
    C(decay, skew)               =  0.115
Null model:
[[Model]]
    Model(constant)
[[Fit Statistics]]
    # function evals   = 11
    # data points      = 548
    # variables        = 1
    chi-square         = 323.422
    reduced chi-square = 0.591
    Akaike info crit   = -286.971
    Bayesian info crit = -282.664
[[Variables]]
    c:   2.70872392 +/- 0.032846 (1.21%) (init= 1)