XPEHH/UGS.CMS/2/1
This page describes a signal of selection found in the
Uganda An. gambiae population
when compared with the Cameroon An. gambiae population
using the XPEHH (Cite et al. 20XX) statistic.The focus of this signal is on chromosome arm
2R between positions 28,860,000 and
28,980,000.
The evidence supporting this signal is
strong ( >= 100 on both flanks).
Signal location. Blue markers show the values of the selection statistic. The dashed black line shows the fitted peak model. The shaded red area shows the focus of the selection signal. The shaded blue area shows the genomic region in linkage with the selection event. Use the mouse wheel or the controls at the top right of the plot to zoom in, and hover over genes to see gene names and descriptions.
Genes
The following 7 genes overlap the focal region: AGAP002888 (GPRNNA3 - putative GPCR class a orphan receptor 3), AGAP013540, AGAP0028891 (NADH dehydrogenase (ubiquinone) 1 subcomplex unknown 2), AGAP002890 (Lipid storage droplets surface-binding protein 1), AGAP002891 (GPRMGL4 - putative metabotropic glutamate receptor 4), AGAP002892 (heterogeneous nuclear ribonucleoprotein F/H), AGAP002893 (mRpS23 - 28S ribosomal protein S23, mitochondrial).
The following 4 genes are within 50 kbp of the focal region: AGAP002886 (GPRNNA2 - putative GPCR class a orphan receptor 2), AGAP0028941 (CYP6Z4 - cytochrome P450), AGAP002895 (mRNA (2’-O-methyladenosine-N6-)-methyltransferase), AGAP002896 (RNA-binding protein Nova).
Key to insecticide resistance candidate gene types: 1 metabolic; 2 target-site; 3 behavioural; 4 cuticular.
Overlapping selection signals
The following selection signals have a focus which overlaps with the focus of this signal.
| Signal | Statistic | Population | Focus | Peak model |
Max. percentile | Known locus |
|---|---|---|---|---|---|---|
| IHS/BFM/2/1 | IHS | Burkina Faso An. coluzzii | 2R:28,700,000-29,020,000 | 468 | 99.8% | nan |
Diagnostics
The information below provides some diagnostics from the Peak modelling algorithm.
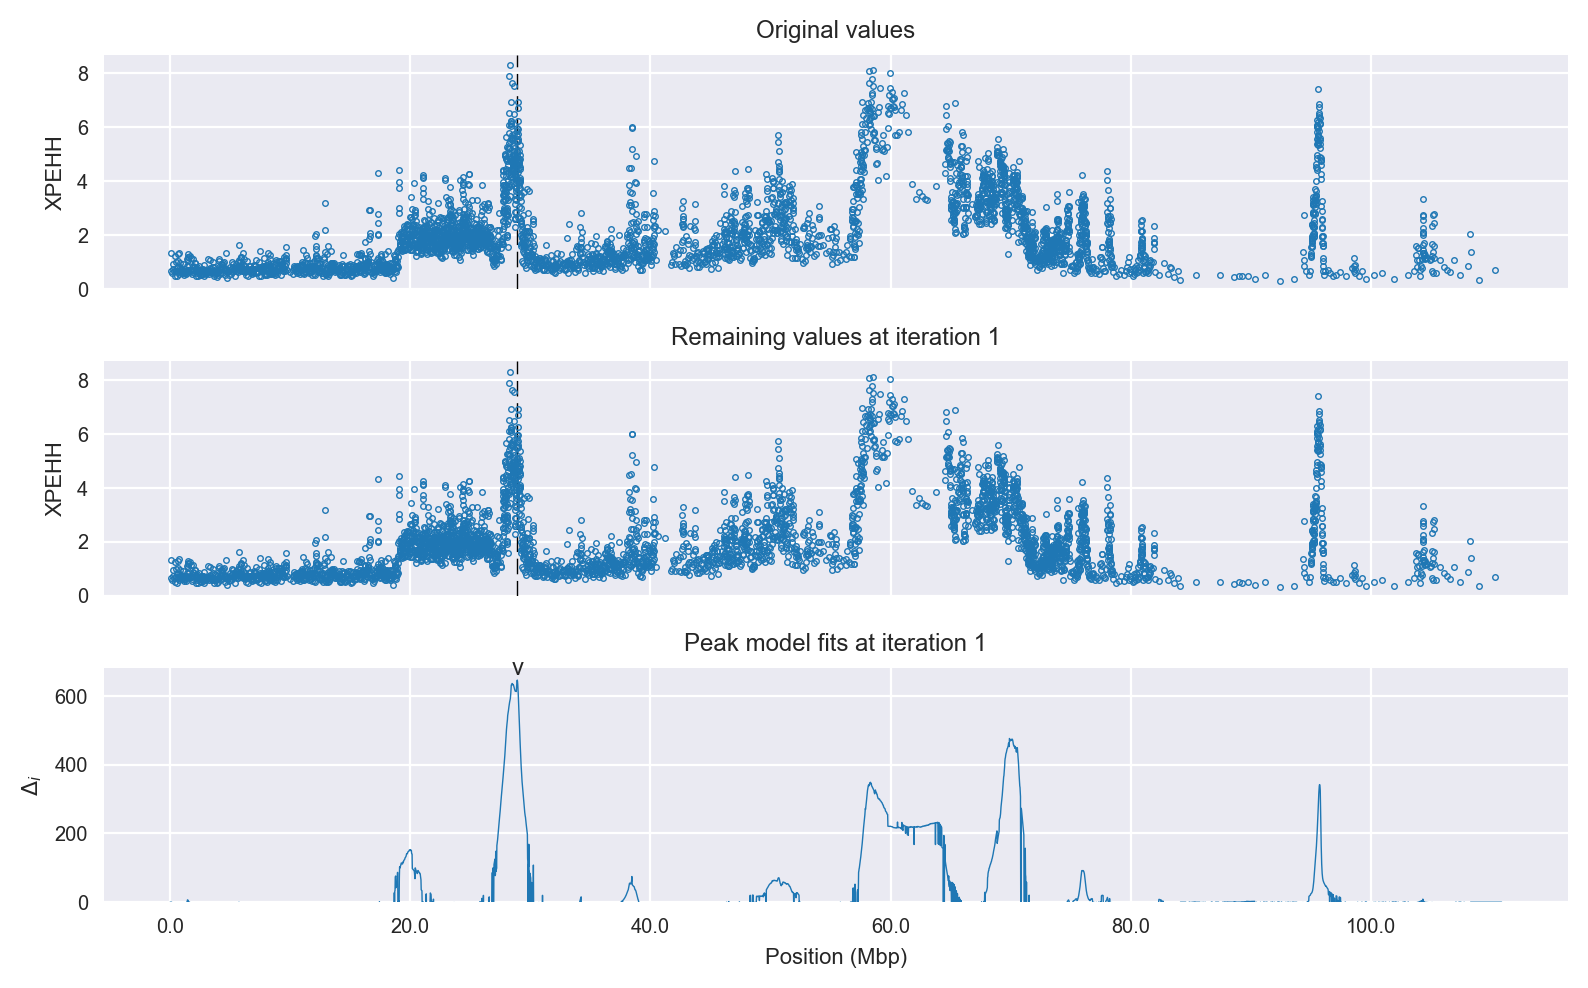
Selection signal in context. @@TODO
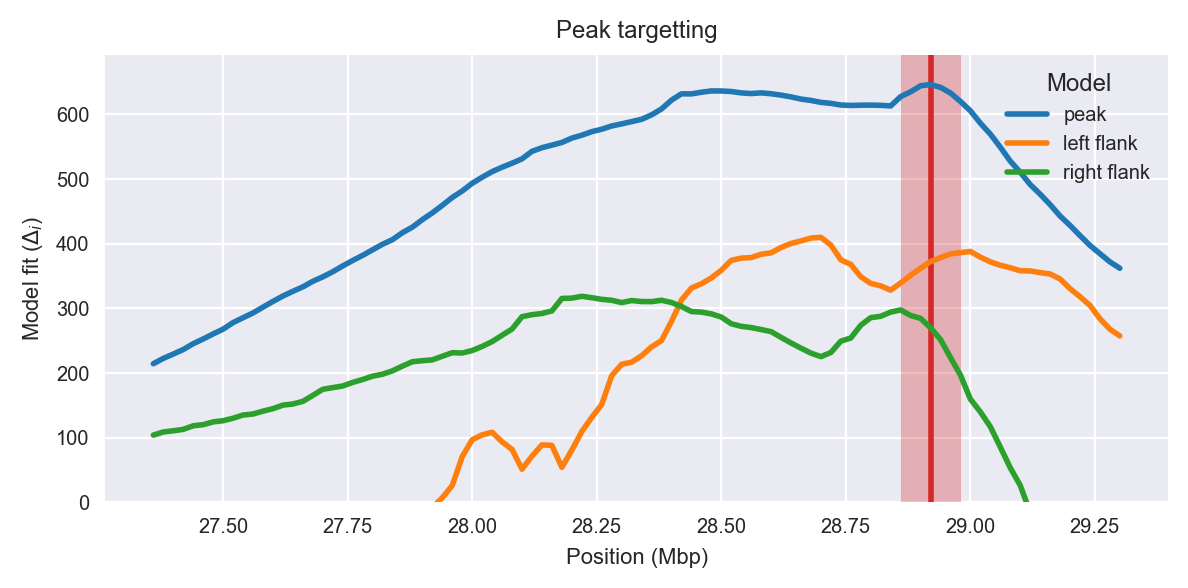
Peak targetting. @@TODO
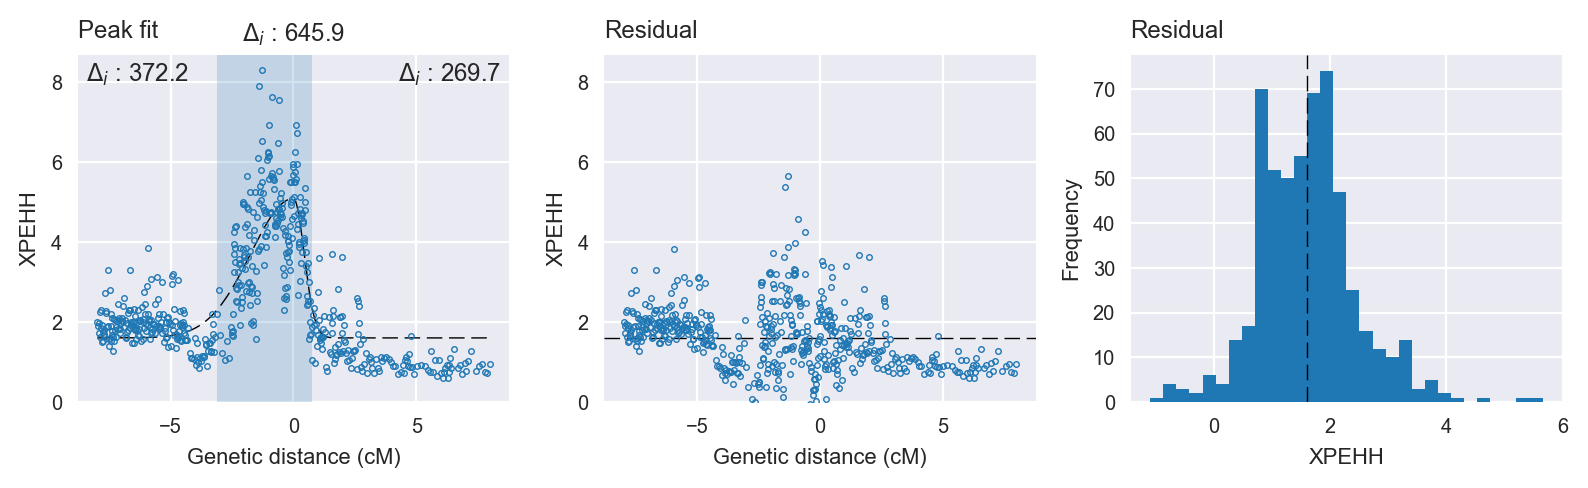
Peak fitting diagnostics. @@TODO
Model fit reports
Peak model:
[[Model]]
    Model(skewed_gaussian)
[[Fit Statistics]]
    # function evals   = 42
    # data points      = 559
    # variables        = 4
    chi-square         = 404.685
    reduced chi-square = 0.729
    Akaike info crit   = -172.579
    Bayesian info crit = -155.275
[[Variables]]
    center:      0 (fixed)
    amplitude:   3.48114181 +/- 0.102960 (2.96%) (init= 3)
    sigma:       0.86829138 +/- 0.039426 (4.54%) (init= 0.5)
    skew:        1          +/- 0.000296 (0.03%) (init= 0)
    baseline:    1.60762328 +/- 0.051409 (3.20%) (init= 1)
    ceiling:     100 (fixed)
    floor:       0 (fixed)
[[Correlations]] (unreported correlations are <  0.100)
    C(sigma, baseline)           = -0.406
    C(amplitude, baseline)       = -0.392
    C(sigma, skew)               =  0.383
    C(amplitude, sigma)          = -0.283
Null model:
[[Model]]
    Model(constant)
[[Fit Statistics]]
    # function evals   = 11
    # data points      = 558
    # variables        = 1
    chi-square         = 1298.534
    reduced chi-square = 2.331
    Akaike info crit   = 473.305
    Bayesian info crit = 477.629
[[Variables]]
    c:   2.62197228 +/- 0.064636 (2.47%) (init= 1)