XPEHH/UGS.CMS/2/4
This page describes a signal of selection found in the
Uganda An. gambiae population
when compared with the Cameroon An. gambiae population
using the XPEHH (Cite et al. 20XX) statistic.The focus of this signal is on chromosome arm
2L between positions 14,374,895 and
14,554,895.
The evidence supporting this signal is
weak ( < 50 on one or both flanks).
Signal location. Blue markers show the values of the selection statistic. The dashed black line shows the fitted peak model. The shaded red area shows the focus of the selection signal. The shaded blue area shows the genomic region in linkage with the selection event. Use the mouse wheel or the controls at the top right of the plot to zoom in, and hover over genes to see gene names and descriptions.
Genes
The following 9 genes overlap the focal region: AGAP005347 (alpha-1,3-mannosyl-glycoprotein beta-1,2-N-acetylglucosaminyltransferase), AGAP005348, AGAP005349, AGAP005350, AGAP005351 (DEAD box polypeptide 5), AGAP005352 (tyrosine-protein phosphatase non-receptor type 1), AGAP005353 (biogenesis of lysosome-related organelles complex 1 subunit 2), AGAP005354, AGAP005355.
The following 3 genes are within 50 kbp of the focal region: AGAP005345, AGAP005346, AGAP005356 (predicted G-protein coupled receptor GPCR).
Key to insecticide resistance candidate gene types: 1 metabolic; 2 target-site; 3 behavioural; 4 cuticular.
Overlapping selection signals
The following selection signals have a focus which overlaps with the focus of this signal.
| Signal | Statistic | Population | Focus | Peak model |
Max. percentile | Known locus |
|---|---|---|---|---|---|---|
| XPEHH/UGS.BFS/2/4 | XPEHH | Uganda An. gambiae | 2L:14,374,895-14,554,895 | 152 | 87.9% | nan |
Diagnostics
The information below provides some diagnostics from the Peak modelling algorithm.
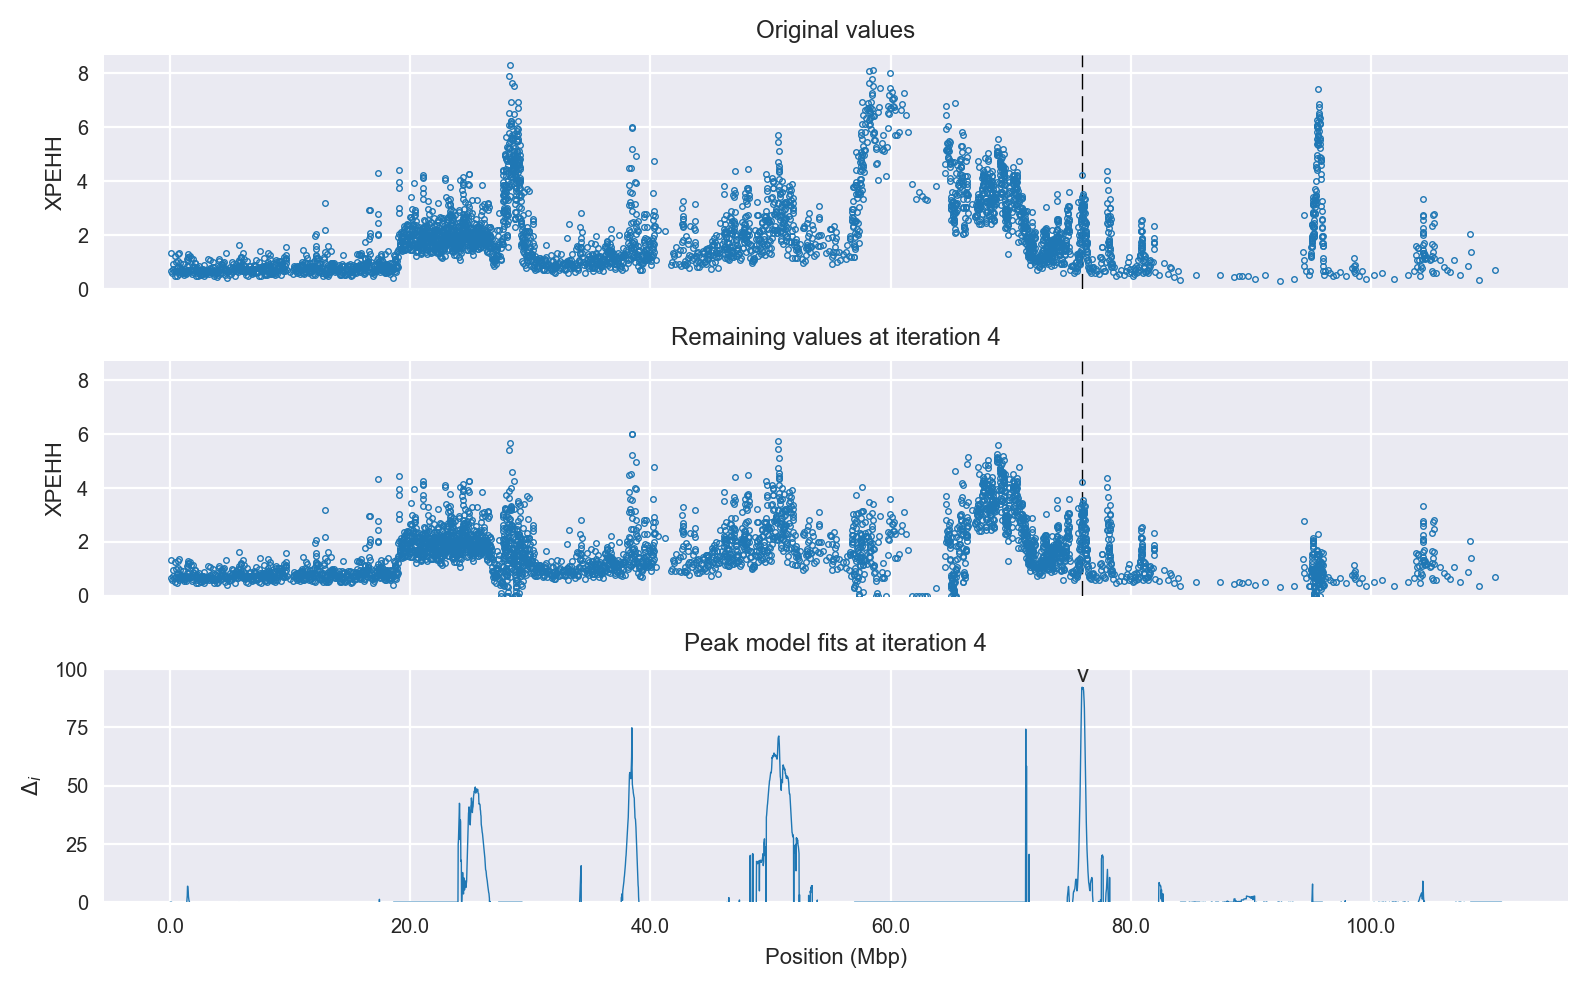
Selection signal in context. @@TODO
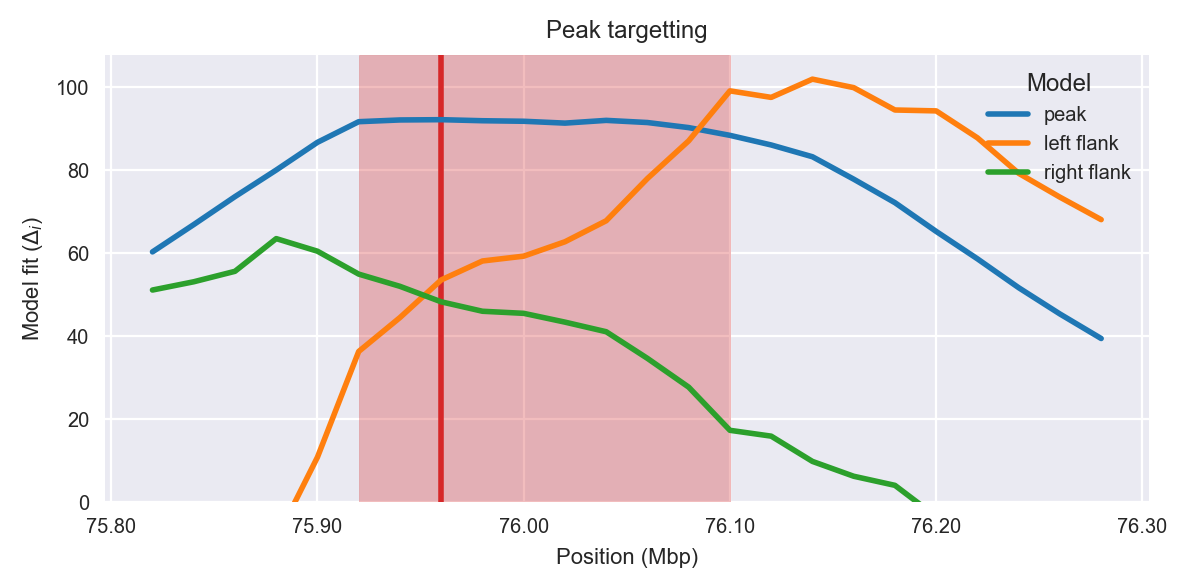
Peak targetting. @@TODO
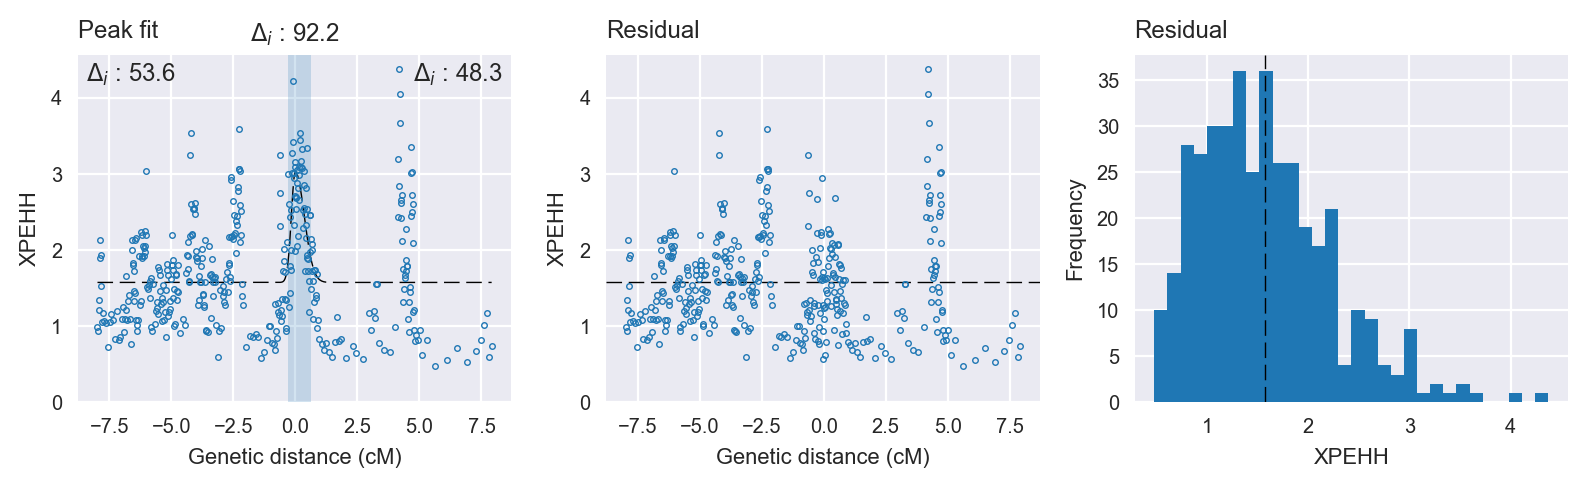
Peak fitting diagnostics. @@TODO
Model fit reports
Peak model:
[[Model]]
    Model(skewed_gaussian)
[[Fit Statistics]]
    # function evals   = 53
    # data points      = 392
    # variables        = 4
    chi-square         = 168.647
    reduced chi-square = 0.435
    Akaike info crit   = -322.633
    Bayesian info crit = -306.748
[[Variables]]
    center:      0 (fixed)
    amplitude:   1.45096649 +/- 0.149138 (10.28%) (init= 3)
    sigma:       0.23895037 +/- 0.032626 (13.65%) (init= 0.5)
    skew:       -0.58581046 +/- 0.162146 (27.68%) (init= 0)
    baseline:    1.57431589 +/- 0.037061 (2.35%) (init= 1)
    ceiling:     100 (fixed)
    floor:       0 (fixed)
[[Correlations]] (unreported correlations are <  0.100)
    C(amplitude, sigma)          = -0.465
    C(sigma, skew)               =  0.367
    C(sigma, baseline)           = -0.227
    C(amplitude, baseline)       = -0.202
Null model:
[[Model]]
    Model(constant)
[[Fit Statistics]]
    # function evals   = 11
    # data points      = 391
    # variables        = 1
    chi-square         = 215.777
    reduced chi-square = 0.553
    Akaike info crit   = -230.434
    Bayesian info crit = -226.466
[[Variables]]
    c:   1.71934753 +/- 0.037616 (2.19%) (init= 1)