H12/CMS/2/1
This page describes a signal of selection found in the
Cameroon An. gambiae populationusing the H12 (Garud et al. 20XX) statistic.The focus of this signal is on chromosome arm
2R between positions 28,460,000 and
28,560,000.
The evidence supporting this signal is
strong ( >= 100 on both flanks).
This signal overlaps the Cyp6p locus, a genome region with prior evidence of an association with insecticide resistance and/or recent positive selection in Anopheles mosquitoes.
Signal location. Blue markers show the values of the selection statistic. The dashed black line shows the fitted peak model. The shaded red area shows the focus of the selection signal. The shaded blue area shows the genomic region in linkage with the selection event. Use the mouse wheel or the controls at the top right of the plot to zoom in, and hover over genes to see gene names and descriptions.
Genes
The following 17 genes overlap the focal region: AGAP002859 (solute carrier family 8 (sodium/calcium exchanger)), AGAP0028621 (CYP6AA1 - cytochrome P450), AGAP0131281 (CYP6AA2 - cytochrome P450), AGAP0028631 (COEAE6O - carboxylesterase alpha esterase), AGAP0028641 (CYP6P15P - cytochrome P450), AGAP0028651 (CYP6P3 - cytochrome P450), AGAP0028661 (CYP6P5 - cytochrome P450), AGAP0028671 (CYP6P4 - cytochrome P450), AGAP0028681 (CYP6P1 - cytochrome P450), AGAP0028691 (CYP6P2 - cytochrome P450), AGAP0028701 (CYP6AD1 - cytochrome P450), AGAP013202, AGAP000586, AGAP002872 (lipase), AGAP002873, AGAP013069, AGAP002874.
The following 7 genes are within 50 kbp of the focal region: AGAP002875 (protein HEXIM1/2), AGAP013244 (adenosine deaminase, tRNA-specific 2, TAD2 homolog), AGAP002876 (single-strand selective monofunctional uracil DNA glycosylase), AGAP002877 (Tetratricopeptide repeat protein 30 homolog), AGAP002878 (Cystatin-like protein), AGAP002879 (cathepsin F), AGAP002880 (COP9 signalosome complex subunit 5).
Key to insecticide resistance candidate gene types: 1 metabolic; 2 target-site; 3 behavioural; 4 cuticular.
Overlapping selection signals
The following selection signals have a focus which overlaps with the focus of this signal.
| Signal | Statistic | Population | Focus | Peak model |
Max. percentile | Known locus |
|---|---|---|---|---|---|---|
| IHS/UGS/2/1 | IHS | Uganda An. gambiae | 2R:28,280,000-28,700,000 | 1,661 | 100.0% | Cyp6p |
| H12/UGS/2/1 | H12 | Uganda An. gambiae | 2R:28,460,000-28,500,000 | 1,567 | 99.2% | Cyp6p |
| IHS/CMS/2/1 | IHS | Cameroon An. gambiae | 2R:28,240,000-28,560,000 | 1,249 | 100.0% | Cyp6p |
| IHS/BFS/2/1 | IHS | Burkina Faso An. gambiae | 2R:28,260,000-28,540,000 | 1,164 | 99.1% | Cyp6p |
| IHS/GNS/2/1 | IHS | Guinea An. gambiae | 2R:28,440,000-28,700,000 | 1,134 | 99.8% | Cyp6p |
| H12/GNS/2/2 | H12 | Guinea An. gambiae | 2R:28,420,000-28,460,000 | 1,073 | 98.5% | Cyp6p |
| H12/BFS/2/2 | H12 | Burkina Faso An. gambiae | 2R:28,440,000-28,480,000 | 976 | 98.4% | Cyp6p |
| XPEHH/UGS.GWA/2/1 | XPEHH | Uganda An. gambiae | 2R:28,460,000-28,600,000 | 758 | 99.7% | Cyp6p |
| XPEHH/BFS.GWA/2/3 | XPEHH | Burkina Faso An. gambiae | 2R:28,420,000-28,500,000 | 697 | 99.1% | Cyp6p |
| XPEHH/CMS.GWA/2/2 | XPEHH | Cameroon An. gambiae | 2R:28,420,000-28,620,000 | 578 | 98.7% | Cyp6p |
| XPEHH/BFM.GWA/2/3 | XPEHH | Burkina Faso An. coluzzii | 2R:28,380,000-28,520,000 | 495 | 99.2% | Cyp6p |
| H12/BFM/2/4 | H12 | Burkina Faso An. coluzzii | 2R:28,420,000-28,520,000 | 366 | 98.5% | Cyp6p |
| H12/AOM/2/6 | H12 | Angola An. coluzzii | 2R:28,440,000-28,480,000 | 235 | 97.8% | Cyp6p |
| XPEHH/CMS.GAS/2/3 | XPEHH | Cameroon An. gambiae | 2R:28,560,000-28,800,000 | 191 | 100.0% | nan |
| XPEHH/AOM.GWA/2/7 | XPEHH | Angola An. coluzzii | 2R:28,480,000-28,520,000 | 92 | 84.1% | Cyp6p |
Diagnostics
The information below provides some diagnostics from the Peak modelling algorithm.
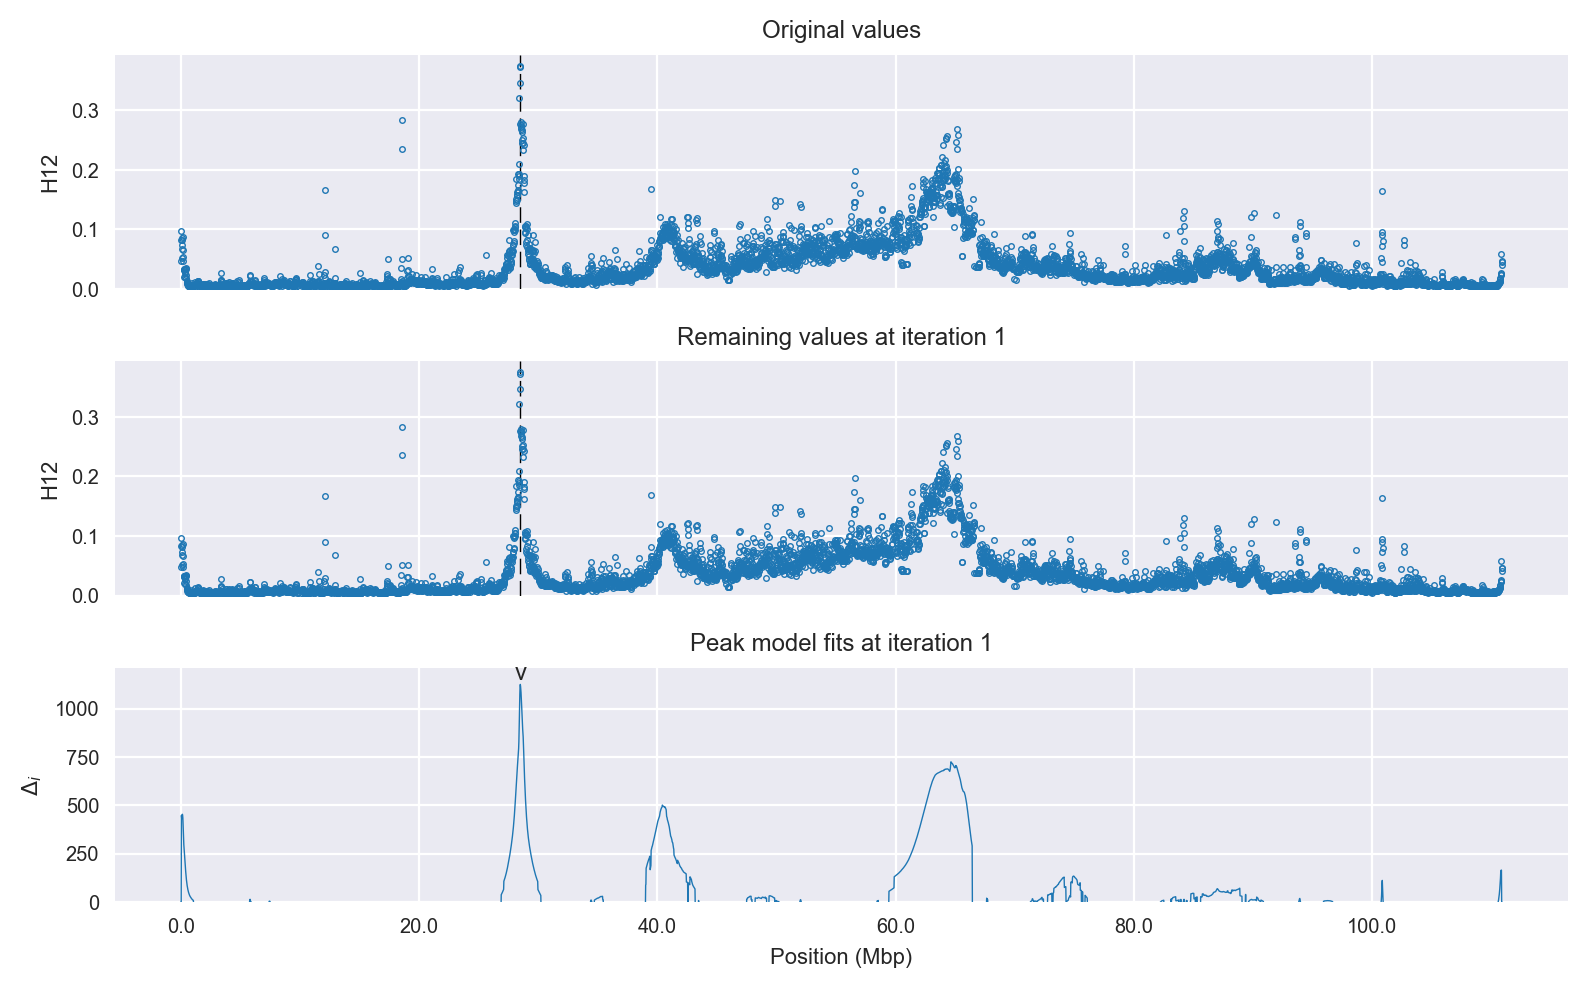
Selection signal in context. @@TODO
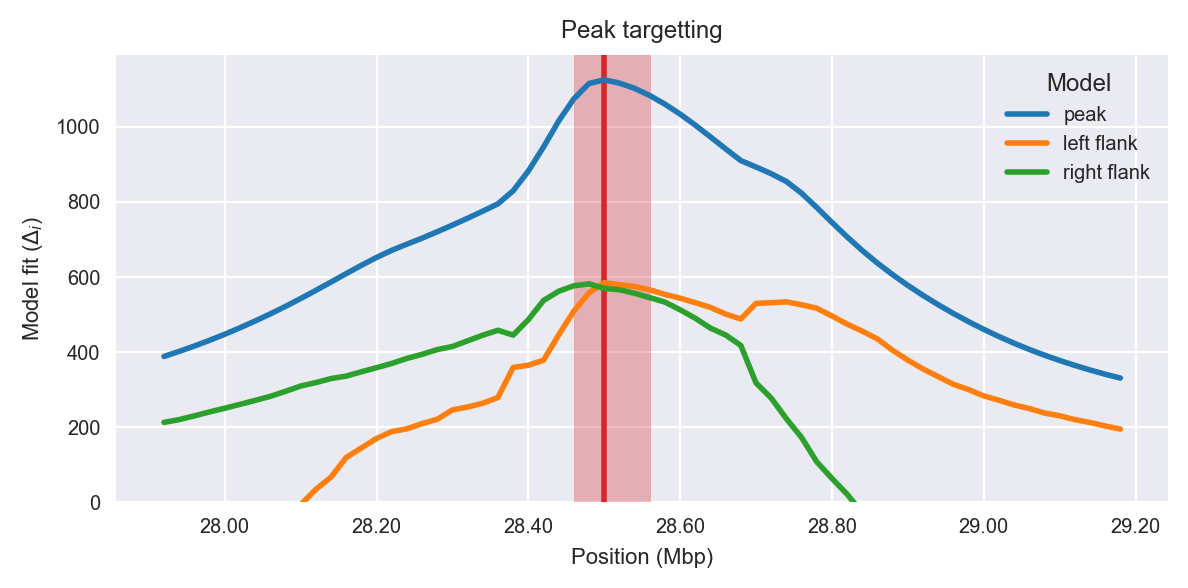
Peak targetting. @@TODO
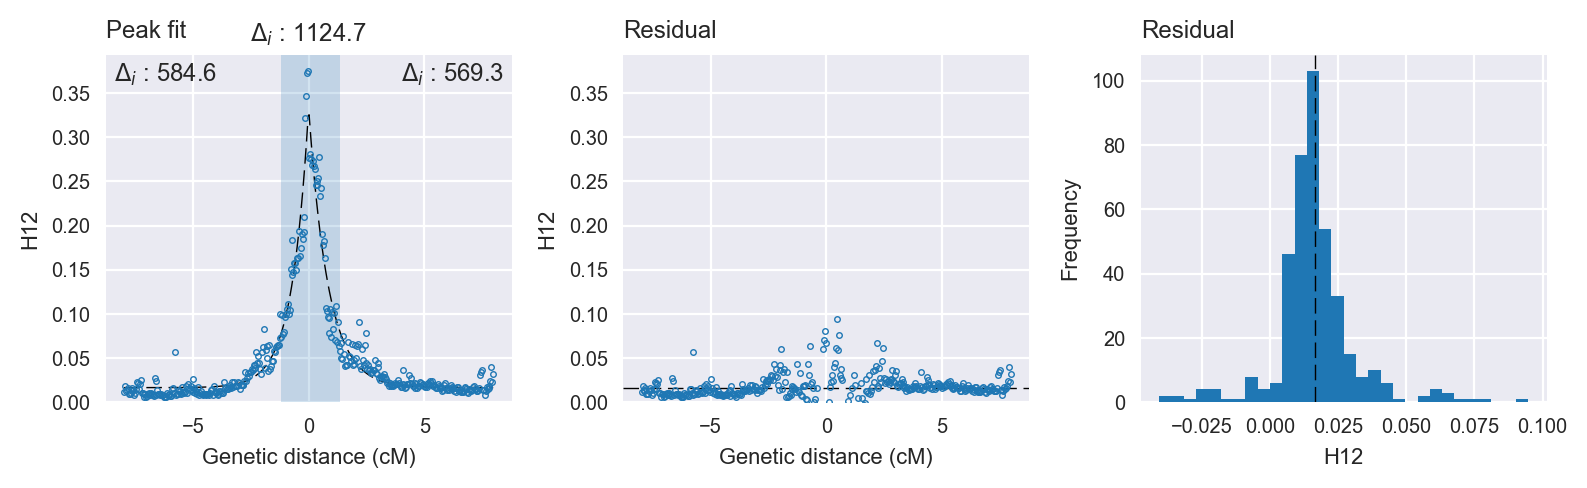
Peak fitting diagnostics. @@TODO
Model fit reports
Peak model:
[[Model]]
    Model(skewed_exponential_peak)
[[Fit Statistics]]
    # function evals   = 33
    # data points      = 399
    # variables        = 4
    chi-square         = 0.093
    reduced chi-square = 0.000
    Akaike info crit   = -3328.536
    Bayesian info crit = -3312.581
[[Variables]]
    center:      0 (fixed)
    amplitude:   0.31622297 +/- 0.004911 (1.55%) (init= 0.5)
    decay:       0.78135431 +/- 0.019752 (2.53%) (init= 0.5)
    skew:       -0.10775594 +/- 0.022452 (20.84%) (init= 0)
    baseline:    0.01650911 +/- 0.000986 (5.97%) (init= 0.03)
    ceiling:     1 (fixed)
    floor:       0 (fixed)
[[Correlations]] (unreported correlations are <  0.100)
    C(amplitude, decay)          = -0.615
    C(decay, baseline)           = -0.493
Null model:
[[Model]]
    Model(constant)
[[Fit Statistics]]
    # function evals   = 10
    # data points      = 398
    # variables        = 1
    chi-square         = 1.559
    reduced chi-square = 0.004
    Akaike info crit   = -2203.856
    Bayesian info crit = -2199.870
[[Variables]]
    c:   0.04672854 +/- 0.003141 (6.72%) (init= 0.03)