IHS/AOM/2/1
This page describes a signal of selection found in the
Angola An. coluzzii populationusing the IHS (Cite et al. 20XX) statistic.The focus of this signal is on chromosome arm
2R between positions 27,980,000 and
28,040,000.
The evidence supporting this signal is
moderate ( >= 50 on both flanks).
Signal location. Blue markers show the values of the selection statistic. The dashed black line shows the fitted peak model. The shaded red area shows the focus of the selection signal. The shaded blue area shows the genomic region in linkage with the selection event. Use the mouse wheel or the controls at the top right of the plot to zoom in, and hover over genes to see gene names and descriptions.
Genes
The following 4 genes overlap the focal region: AGAP002822, AGAP002823 (Med7 - Mediator of RNA polymerase II transcription subunit 7), AGAP002824 (GPRTAK1 - putative tachykinin receptor 1), AGAP0028251 (PPO1 - prophenoloxidase 1).
The following 13 genes are within 50 kbp of the focal region: AGAP002815 (CLIPA15 - CLIP-domain serine protease), AGAP0028161 (ERO1-like protein alpha), AGAP002817, AGAP002818, AGAP002819, AGAP002820, AGAP002821, AGAP002826, AGAP002828, AGAP002829 (SPN-E - ATP-dependent RNA helicase spindle-E), AGAP0028301 (C-1-tetrahydrofolate synthase, mitochondrial precursor), AGAP002831 (ribosomal RNA small subunit methyltransferase H), AGAP013130.
Key to insecticide resistance candidate gene types: 1 metabolic; 2 target-site; 3 behavioural; 4 cuticular.
Overlapping selection signals
The following selection signals have a focus which overlaps with the focus of this signal.
| Signal | Statistic | Population | Focus | Peak model |
Max. percentile | Known locus |
|---|---|---|---|---|---|---|
| XPEHH/UGS.BFS/2/1 | XPEHH | Uganda An. gambiae | 2R:27,980,000-28,280,000 | 753 | 99.9% | nan |
| H12/AOM/2/2 | H12 | Angola An. coluzzii | 2R:28,040,000-28,080,000 | 478 | 100.0% | nan |
| XPEHH/AOM.BFM/2/3 | XPEHH | Angola An. coluzzii | 2R:28,000,000-28,060,000 | 295 | 99.4% | nan |
| XPEHH/AOM.GWA/2/5 | XPEHH | Angola An. coluzzii | 2R:27,980,000-28,040,000 | 96 | 95.2% | nan |
Diagnostics
The information below provides some diagnostics from the Peak modelling algorithm.
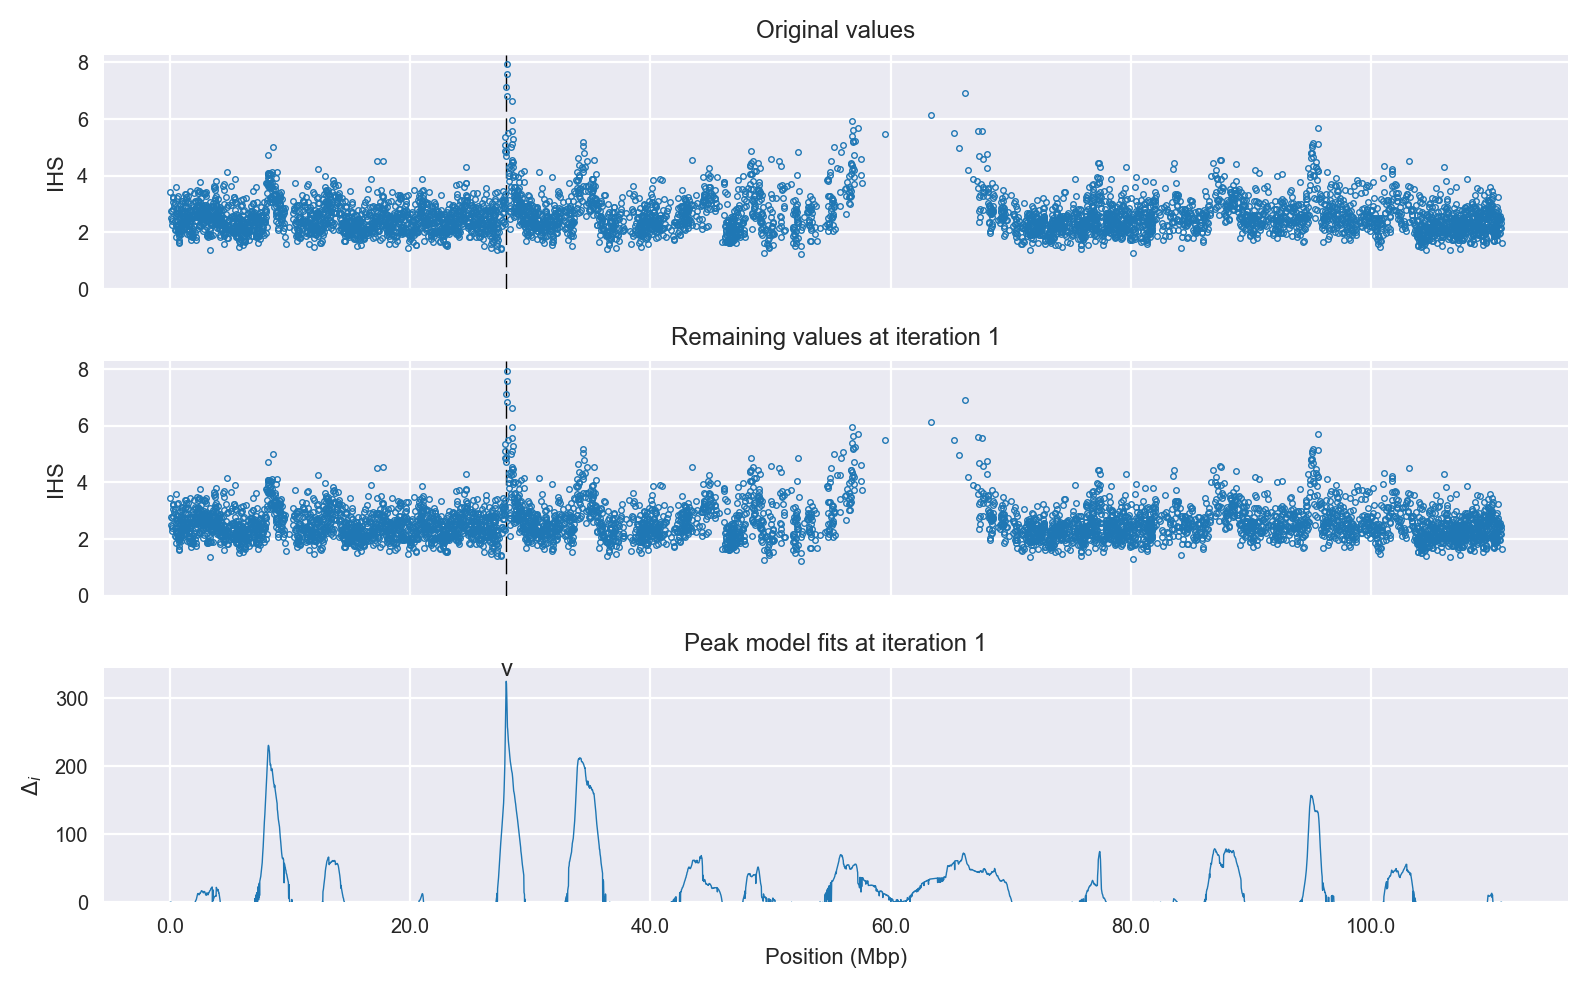
Selection signal in context. @@TODO
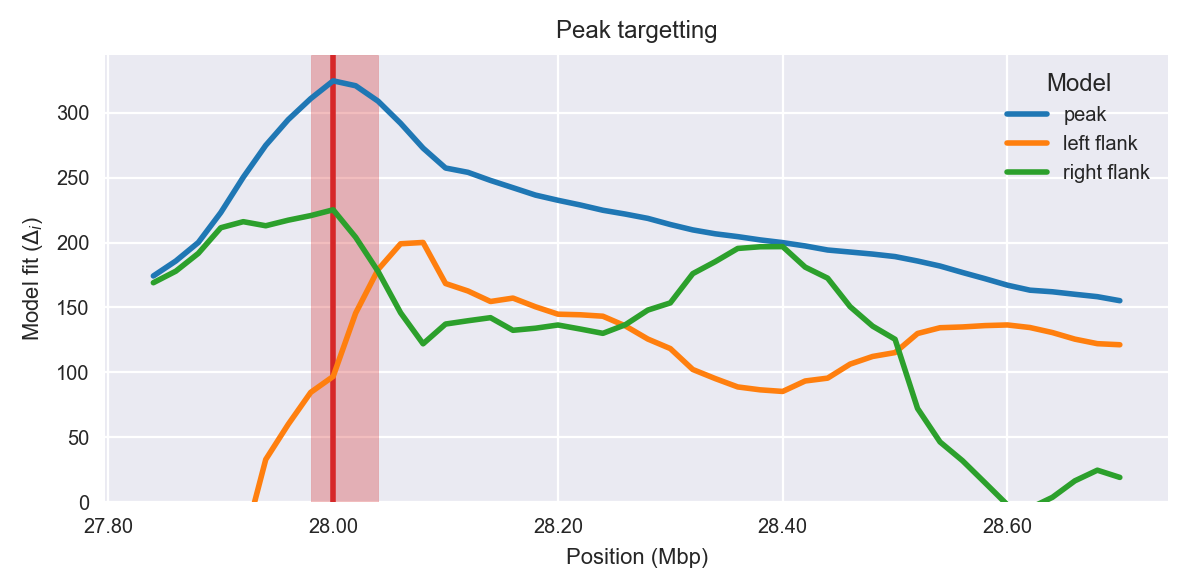
Peak targetting. @@TODO
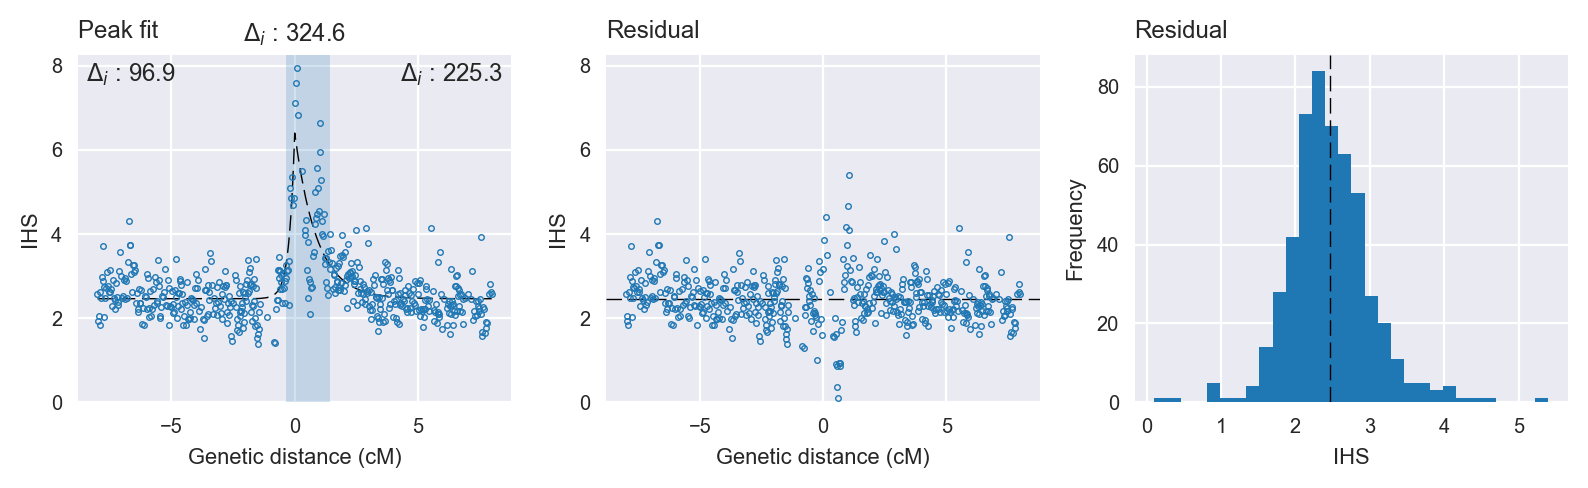
Peak fitting diagnostics. @@TODO
Model fit reports
Peak model:
[[Model]]
    Model(skewed_exponential_peak)
[[Fit Statistics]]
    # function evals   = 64
    # data points      = 519
    # variables        = 4
    chi-square         = 162.361
    reduced chi-square = 0.315
    Akaike info crit   = -595.121
    Bayesian info crit = -578.113
[[Variables]]
    center:      0 (fixed)
    amplitude:   3.94623832 +/- 0.235504 (5.97%) (init= 3)
    decay:       0.44748038 +/- 0.037263 (8.33%) (init= 0.5)
    skew:       -0.99999999 +/- 0.034619 (3.46%) (init= 0)
    baseline:    2.46001044 +/- 0.029280 (1.19%) (init= 1)
    ceiling:     100 (fixed)
    floor:       0 (fixed)
[[Correlations]] (unreported correlations are <  0.100)
    C(amplitude, decay)          = -0.642
    C(decay, skew)               =  0.417
    C(decay, baseline)           = -0.371
Null model:
[[Model]]
    Model(constant)
[[Fit Statistics]]
    # function evals   = 11
    # data points      = 518
    # variables        = 1
    chi-square         = 306.067
    reduced chi-square = 0.592
    Akaike info crit   = -270.557
    Bayesian info crit = -266.307
[[Variables]]
    c:   2.68589726 +/- 0.033805 (1.26%) (init= 1)